User Interface Tour
The Cybereason user interface provides a comprehensive view of your Cybereason Platform.
You can perform tasks such as:
View a high-level overview of MalOps and malware
Analyze and respond to individual MalOps
Manage malware alerts
Hunt and investigate
Set reputations
Manage sensors, servers, and users
Create and assign security policies
Set password and authentication policies
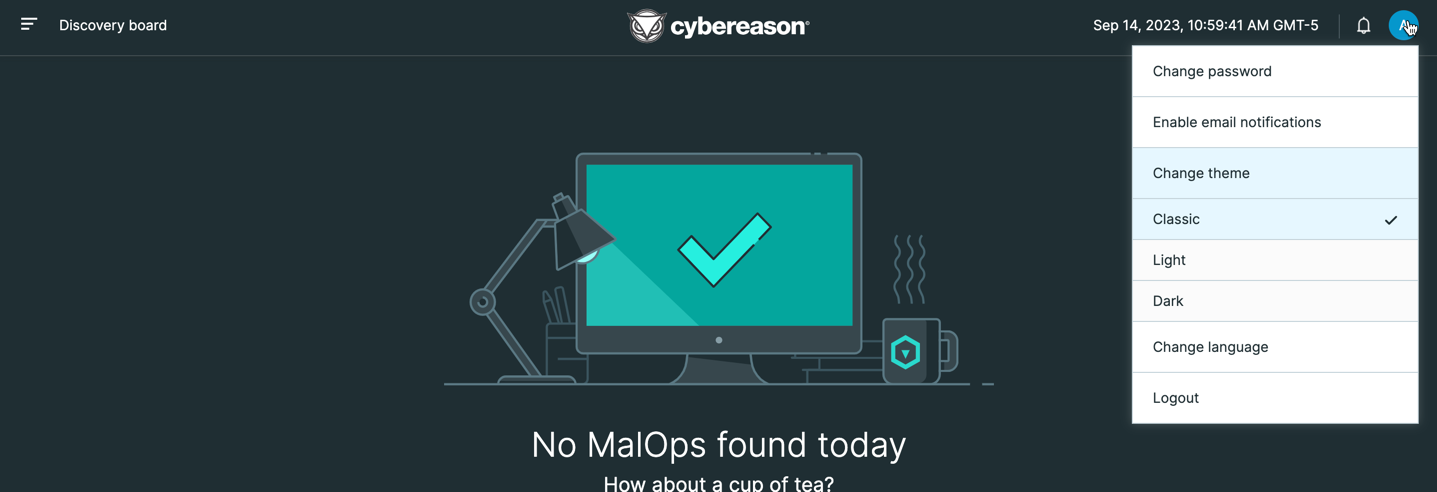
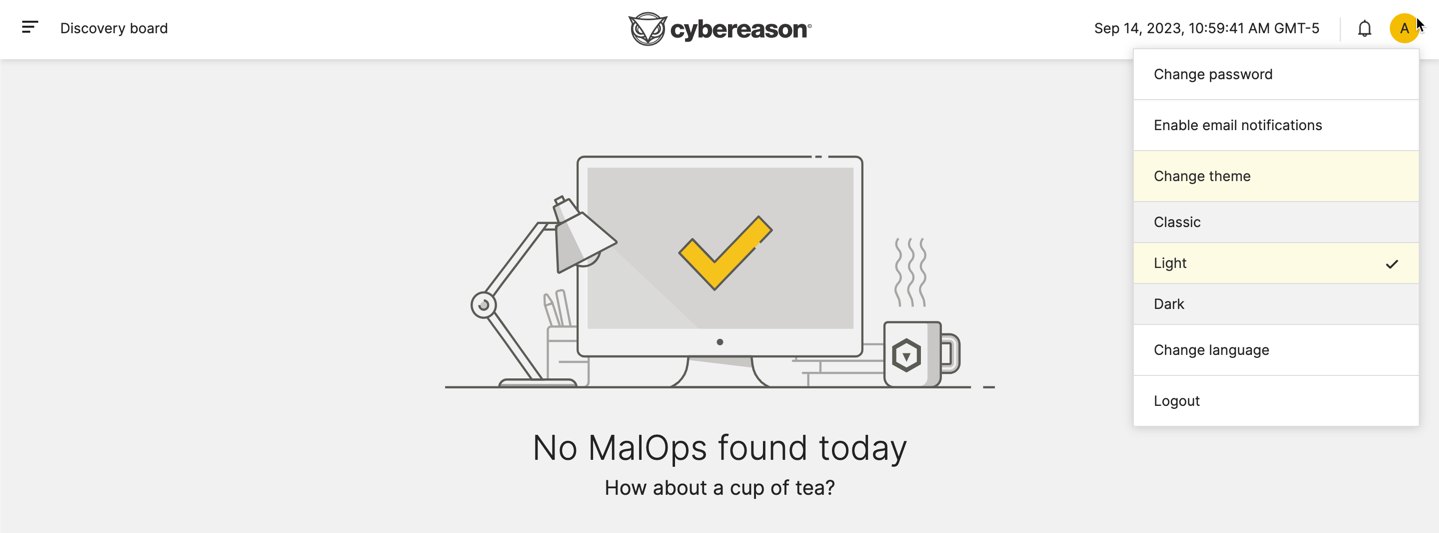
In versions 23.2.2X and later, you can also select the theme for the different screens in the Cybereason platform.
Note
The ability to select the theme for the user interface is not generally available. Contact your Customer Success Manager to gain access to this feature.
Classic theme:
Light theme:
Dark theme:
In this topic:
UI Tour Video
Watch this video for an overview of the Cybereason UI.
Login
Before you log in, Cybereason Customer Success gives you a URL for the Cybereason UI, a username, and a password.
To log in to Cybereason, navigate to the URL for the Cybereason UI, and then enter the username and password in the login screen.
Enter the username and password provided to you by Customer Success to login to the Cybereason UI.
The Cybereason UI opens, showing the EPP Overview dashboard.
EPP Overview Dashboard
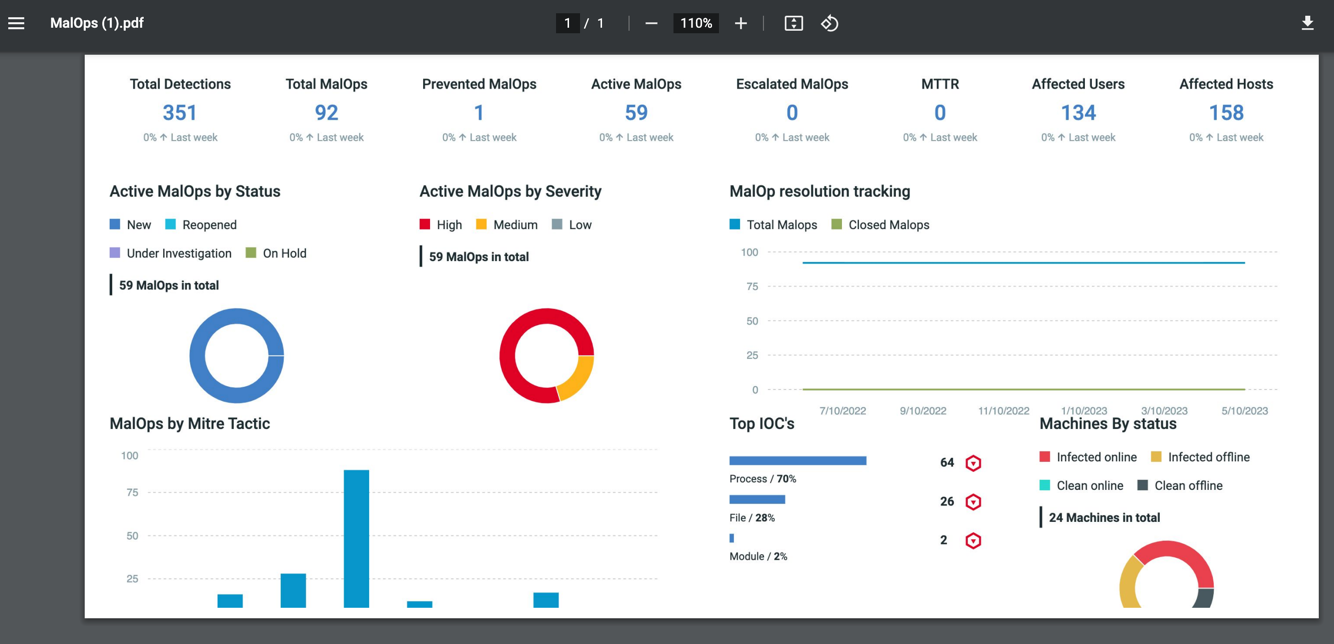
When you log in to the Cybereason platform, the EPP Overview Dashboard screen opens. This screen provides a high-level overview of the recent threats that the Cybereason platform has detected.
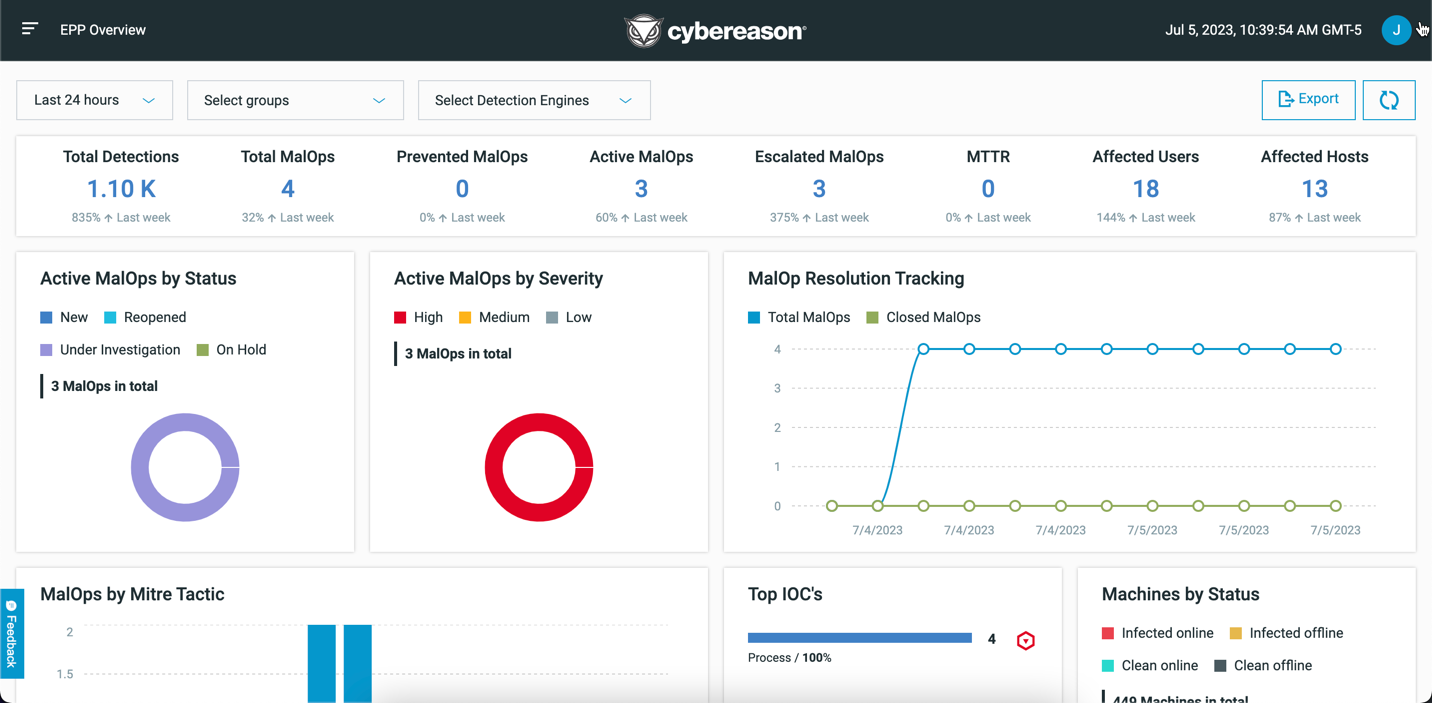
At the top of the Dashboard, you can view a high-level summary of all detected activity in the selected time frame, including:
Summary item |
Description |
|---|---|
Total detections |
The total number of suspicions created in the selected time period. |
Total MalOps |
The total number of MalOps created in the selected time period independently of the current state or status of the MalOp. |
Prevented MalOps |
The total number of MalOps prevented for the selected time period. |
Active MalOps |
The total number of open or active MalOps for the selected time period. This count does not include Resolved or Excluded MalOps. |
Escalated MalOps |
The total number of MalOps escalated for the selected time period. |
Mean Time to Repair or Resolution (MTTR) |
The average time to resolve a MalOp in the selected time period. This is the average of Closed and Creation Time for all MalOps closed in the selected time period (usually measured in days). |
Affected users |
The number of users with at least one MalOp (not including Resolved or Excluded MalOps). |
Affected hosts |
The cumulative number of hosts associated with MalOps over the selected time period (not including Resolved or Excluded MalOps). This number does not correspond with the number of sensors installed, but instead shows a total number of hosts that have been involved in MalOps. |
In addition to the summary, you can view a number of different graphs in the dashboard, including:
Graph |
Details |
|---|---|
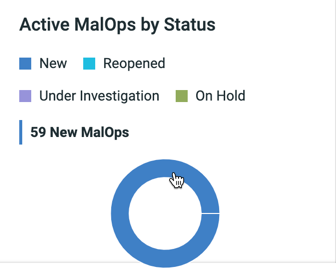
Active MalOps by status |
The total number of MalOps for each investigation status. This help you understand if MalOps have been analyzed or triaged in a timely manner by your team. |
Active MalOps by severity |
The total number of MalOps grouped by the calculated severity of the MalOp. This graph helps you analyze the severity and urgency of all detected malicious activity in your environment. |
MalOp resolution tracking |
The trend of all MalOps triggered over time, as well as MalOps closed in the selected time frame. This graph helps you ensure that MalOps are being analyzed and triaged in an appropriate manner by your team. |
MalOps by Mitre Tactic |
The number of times a MITRE attack is associated with a MalOp or the detections that led to a MalOp. |
MalOps by detection engine |
All MalOps sorted by the different detection engines used by the Cybereason platform. |
Top IOCs |
The top 5 IOCs that were root causes of MalOps. These IOCs can be:
|
Machines by status |
The total number of machines grouped by status, including:
|
Click on any section of a graph to navigate to the relevant screen to learn more. For example, if you click on a section in one of the Active MalOps graphs, you will open the Malops management screen filtered accordingly. You can also click on MalOps by MITRE tactic graph to navigate to the most critical MalOps for your organization. For example, click on the Tactic Impact and see the corresponding MalOps.
If you click on a section in the Top IOCs graph, you open the Investigation screen to learn more.
As needed, you can filter the various graphs and charts by time or by detection engine:
If your environment uses sensor grouping, you can also filter by sensor groups.
You can also export your current view to a PDF document if you need to share the dashboard with others. In the upper right corner of the screen, click Export to save the current view to a PDF file:
Discovery Board (deprecated)
Note
The Discovery Board is deprecated and is now replaced by the EPP Overview dashboard. The Discovery Board will continue to be available for existing customers until the end-of-life (EOL) period, but Cybereason recommends that you transition to the EPP Overview dashboard instead. New customers will not have access to the Discovery dashboard.
The Discovery board provides a high-level overview of the recent threats that Cybereason has detected.
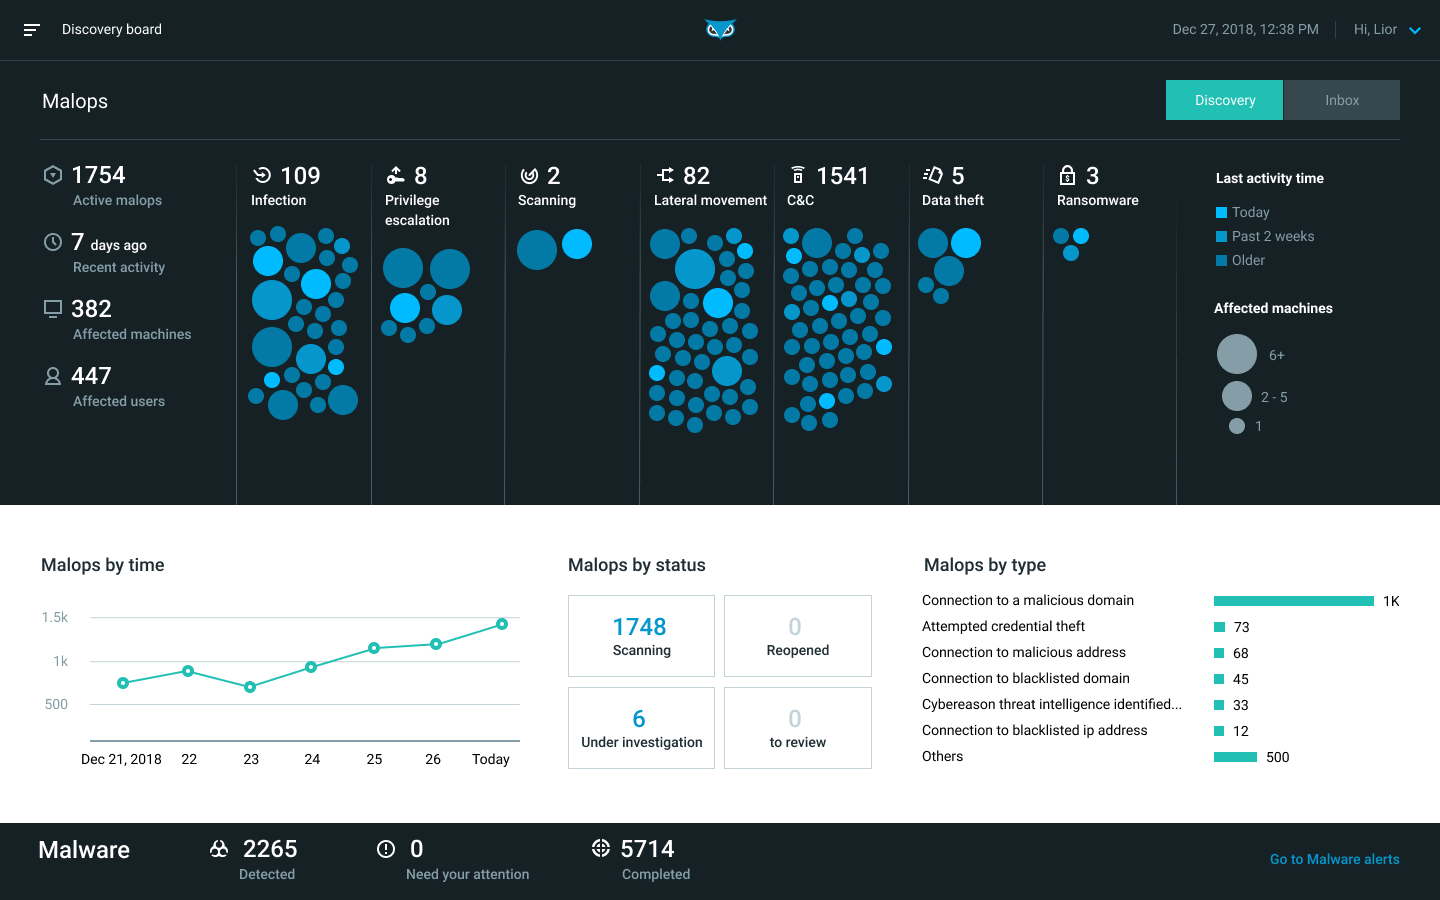
From the Discovery board, you can view Malops by:
Activity
Type
Time
Status
In the upper area of the screen, Malops are represented by colored circles.
The Malops are grouped according to their place in the attack lifecycle.
Larger circles indicate a larger number of affected machines.
Circles with a lighter color indicate more recent activity.
To further investigate a specific Malop, click a Malop on this screen.
The bottom area of the screen includes a summary of malware alerts. For more details, see Manage Malware Alerts.
Malop Management
Note
The Malops management screen replaces the Malop inbox and Malware alerts screens from previous Cybereason versions. The Malop inbox and Malware alerts screens will remain in the UI temporarily to allow current customers to make the transition.
The Malops management screen provides a unified view of all MalOps in your environment, including MalOps that the Cybereason platform’s automatic hunting engine generates as well as MalOps that the Cybereason NGAV service generates.
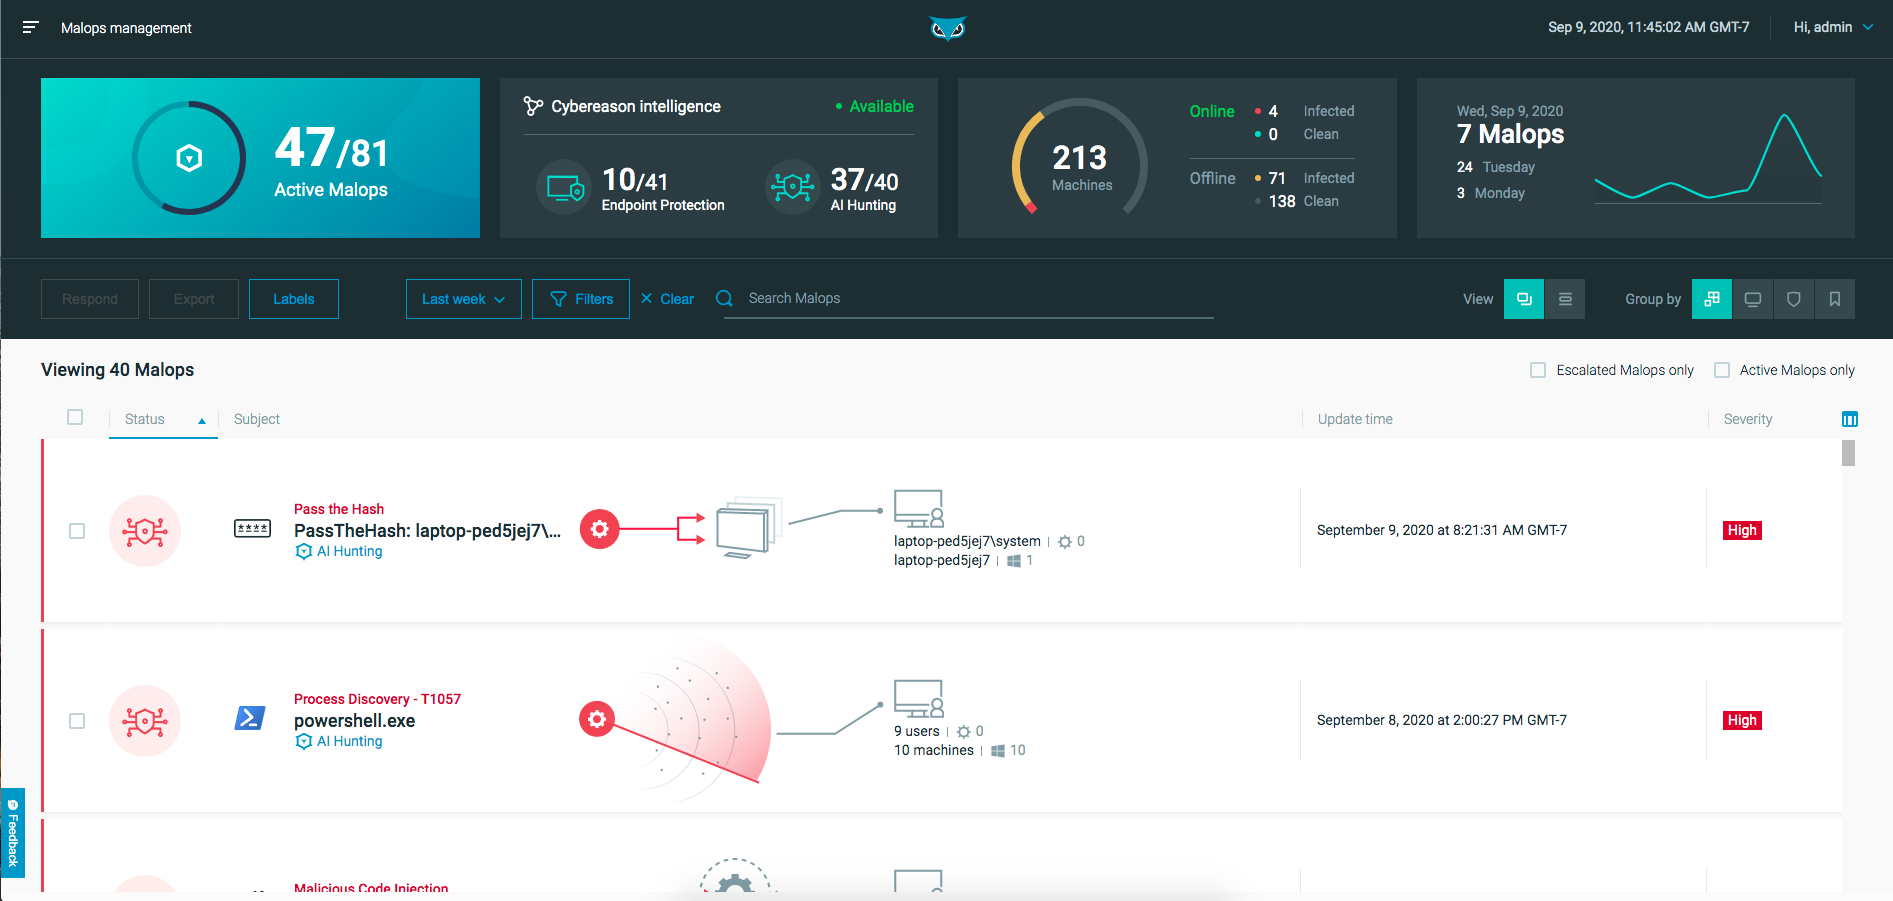
From the Malops management screen, you can:
View Malops (if you do not have the new Data Platform) or View MalOps with the Data Platform Architecture (if you have the new Data Platform)
Access the Malop Details screen for each MalOp
Malop Inbox (deprecated)
Note
For existing Cybereason environments, the Malop inbox screen is now deprecated. You can still use the Malop inbox to interact with Malops, but we recommend that you transition to use of the Malops management screen instead.
The Malop inbox displays the malicious operations that the Cybereason platform detects in your organization.
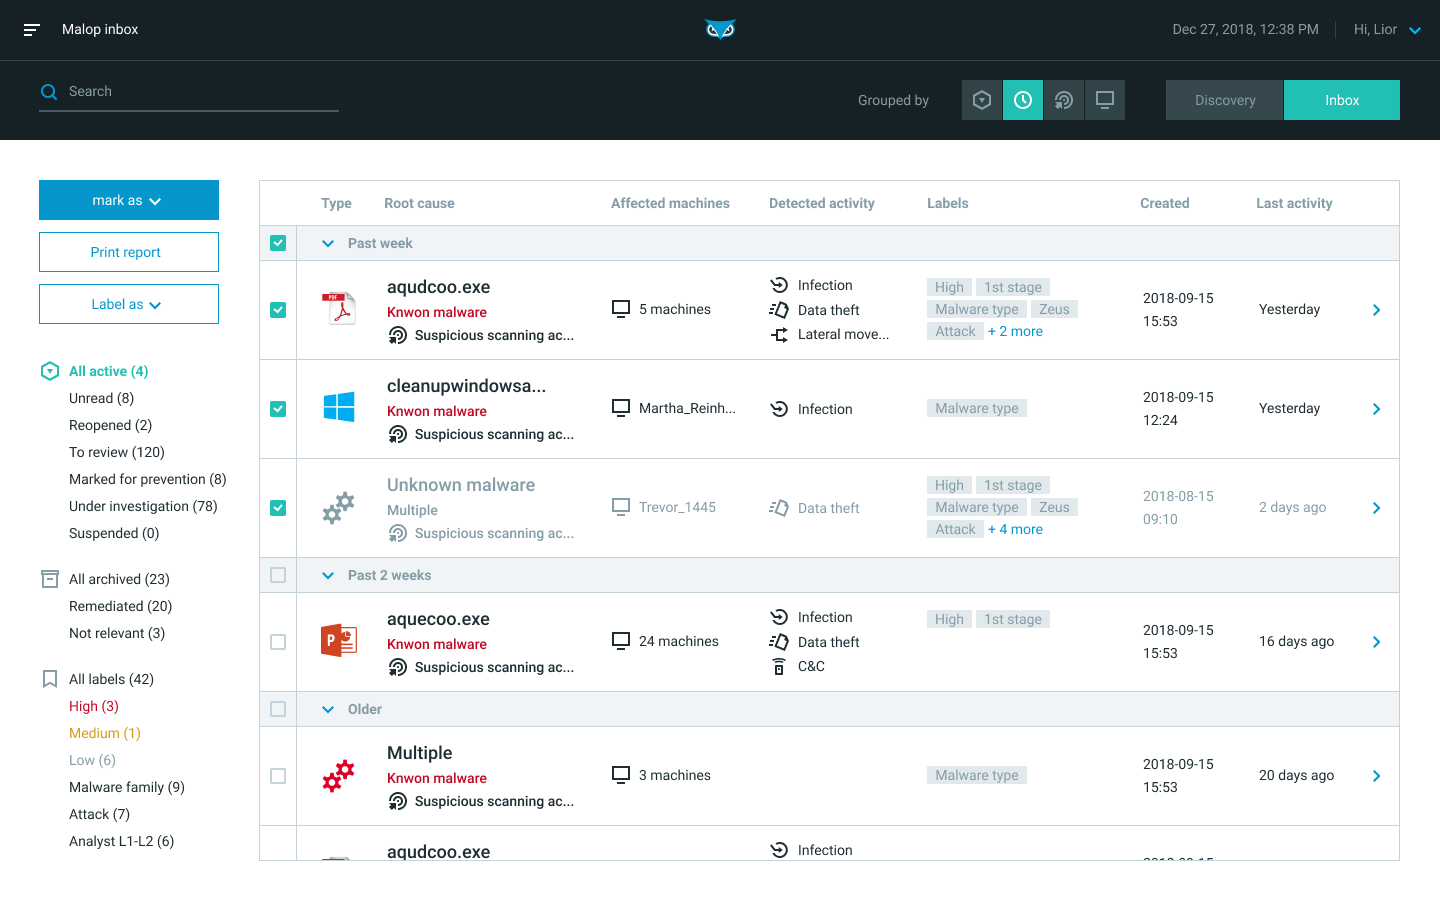
From the Malop inbox, you can:
Group and filter MalOps to gain an understanding of your system status
Add, remove, and create priority and custom MalOp labels
Sort the list by Type, Root causes, Affected machines, Detected activity, Labels, creation date, time of last activity, and Status
Assign or archive one or more MalOps
Drill down into the details of a MalOp
For more details on analyzing Malops, see Analyze MalOps and Determine Threat Level.
Malware Alerts
Note
The Malops management screen replaces the Malware alerts screen. You can still use the Malware alerts screen to interact with malware, but we recommend that you transition to the new view.
Analysts can monitor and manage malware alerts that are generated by your Endpoint Prevention and NGAV settings in the Malware alerts screen.
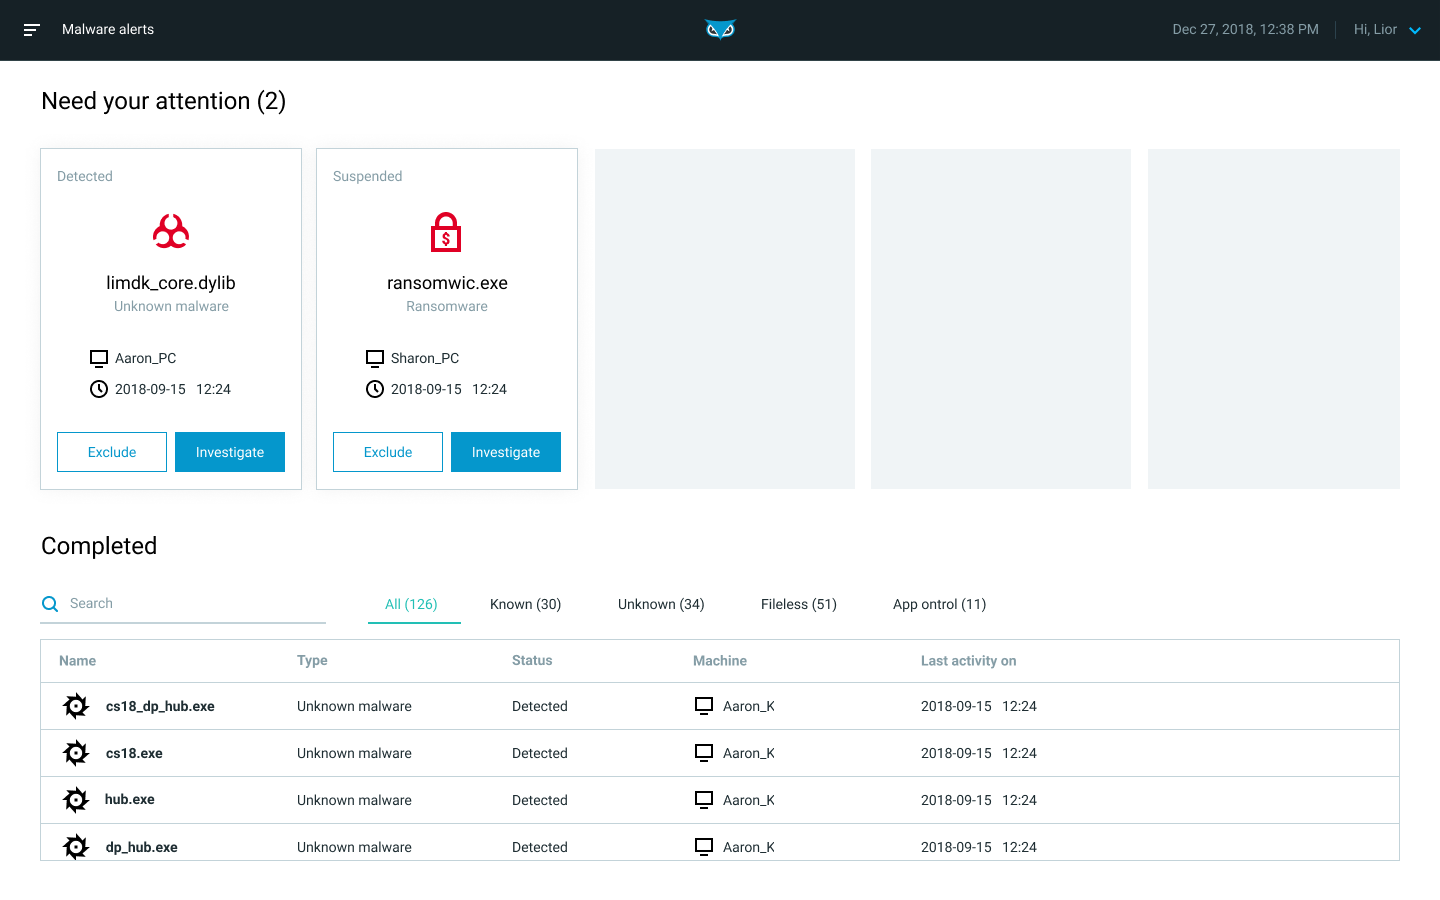
In this screen you can:
View malware alerts that need your attention
Investigate malware in more detail
View alerts that have been address (according to your sensor policy settings)
For more details, see Manage Malware Alerts, How to Manage and Respond to NGAV Detections on the MalOps Management Screen.
Malop Details
When you drill down into a specific MalOp, you’ll see the Malops details screen, which displays a graphical and textual view of the MalOp you selected.
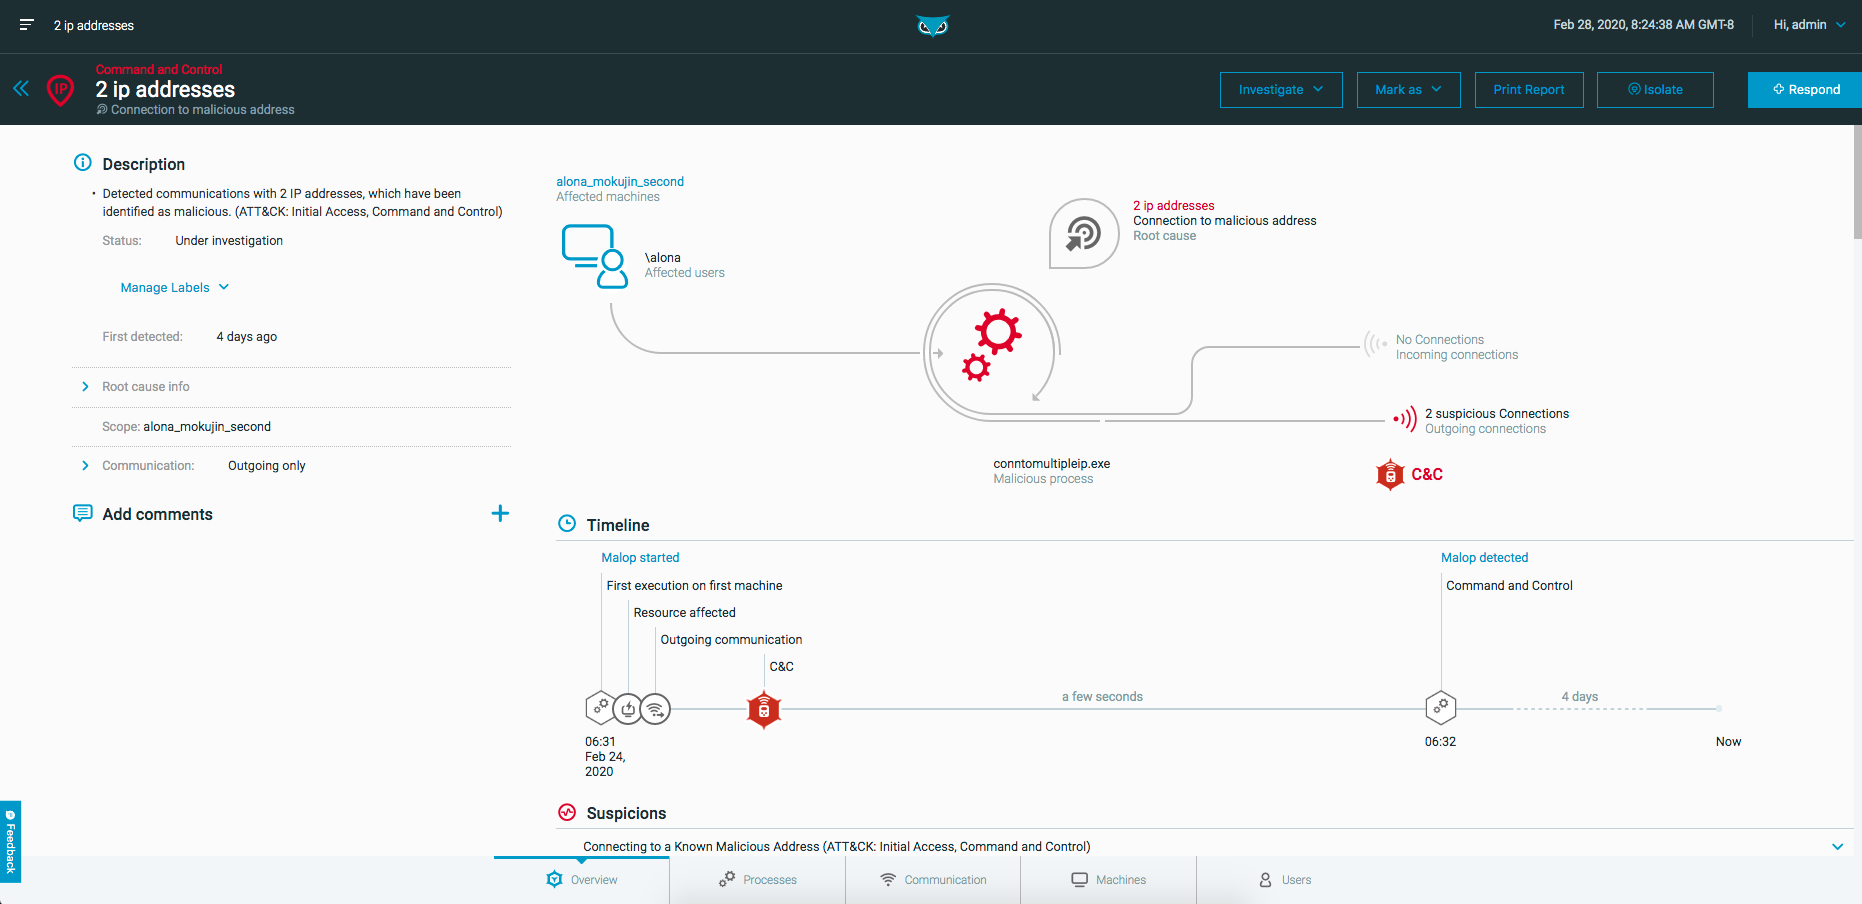
Depending on the MalOp, the Malop details screen contains the following tabs:
Overview: Provides the high-level details of the MalOp, including a description and a visual diagram.
Processes: Provides an in-depth look at the malicious processes associated with the Malop.
Files: Appears for Endpoint Protection MalOps. Lists information about files that are associated with the detected malware.
Machines: Provides information about the machine on which the MalOp was discovered.
Users: Provides information about users associated with the MalOp.
Communications: Provides information about any incoming and outgoing communications that are associated with the malicious behavior.
For more details, see Examine MalOp Details.
Investigation
The Investigation screen enables you to query endpoint sensor, CWP sensor, and XDR log source data. Use this screen to investigate Malops and malware, and to conduct hunts for malicious behavior.
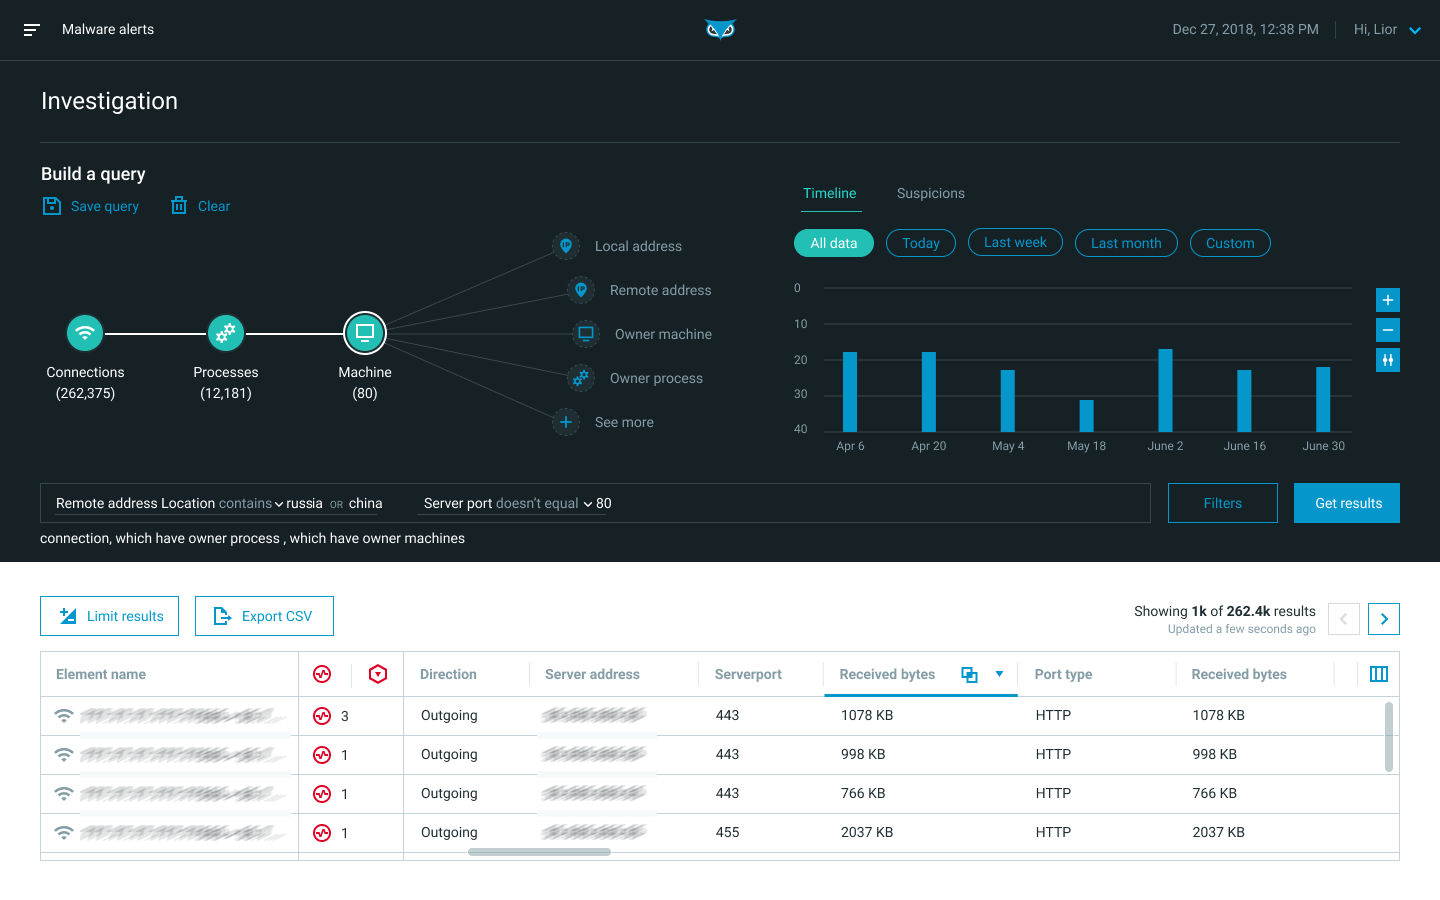
In the Investigation screen, you can:
Construct a query
Inspect results in a grid view or timeline view
Dive into specific Elements in the Element Details screen
You can start an investigation directly from the Investigation screen, from the MalOp detail screen’s Process tab, or from the Malware alerts screen.
For more details on investigation, see Perform a Hunt or Investigation.
For details on Elements and their Features, see Query Elements and Features.
Element Details
The Element Details screen provides more information on suspicions you reveal when investigating.
On the Investigation screen, click an Element from the results of your investigation to reveal the Element Details screen.
Click the Expand button to open the details summary in a new window.
Click any Element in the tree to view more details about that specific Element.
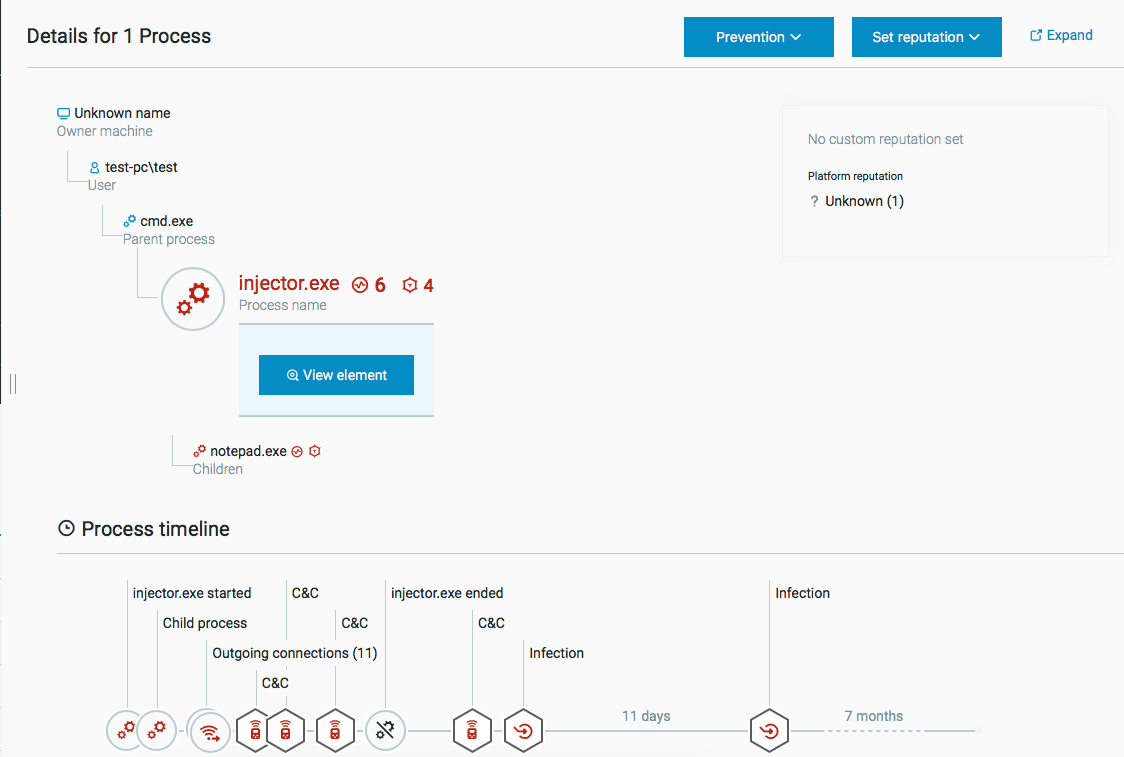
Use the Element Details screen to view:
Affected machines, users, connections, and session
A timeline
Properties
Suspicions and evidence associated with the Element
Reputation status of the Element (allowlist or blocklist)
Malops associated with the Element
Note
Some details apply only to certain Element types, such as processes.
Security Profile
The Security profile screen allows you to manage security profile settings for your organization.
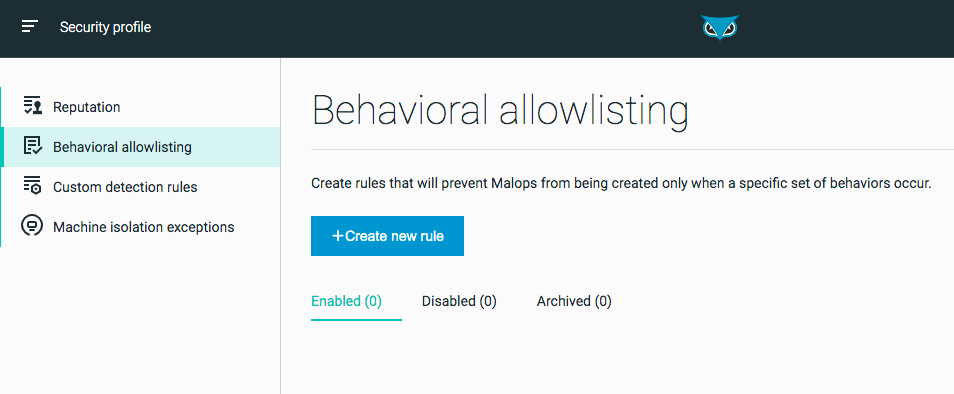
From the Security profile screen you can:
System
The tabs in the System screen allow you to view and manage your organization’s sensors and servers, including the ability to create and manage sensor policies and groups.
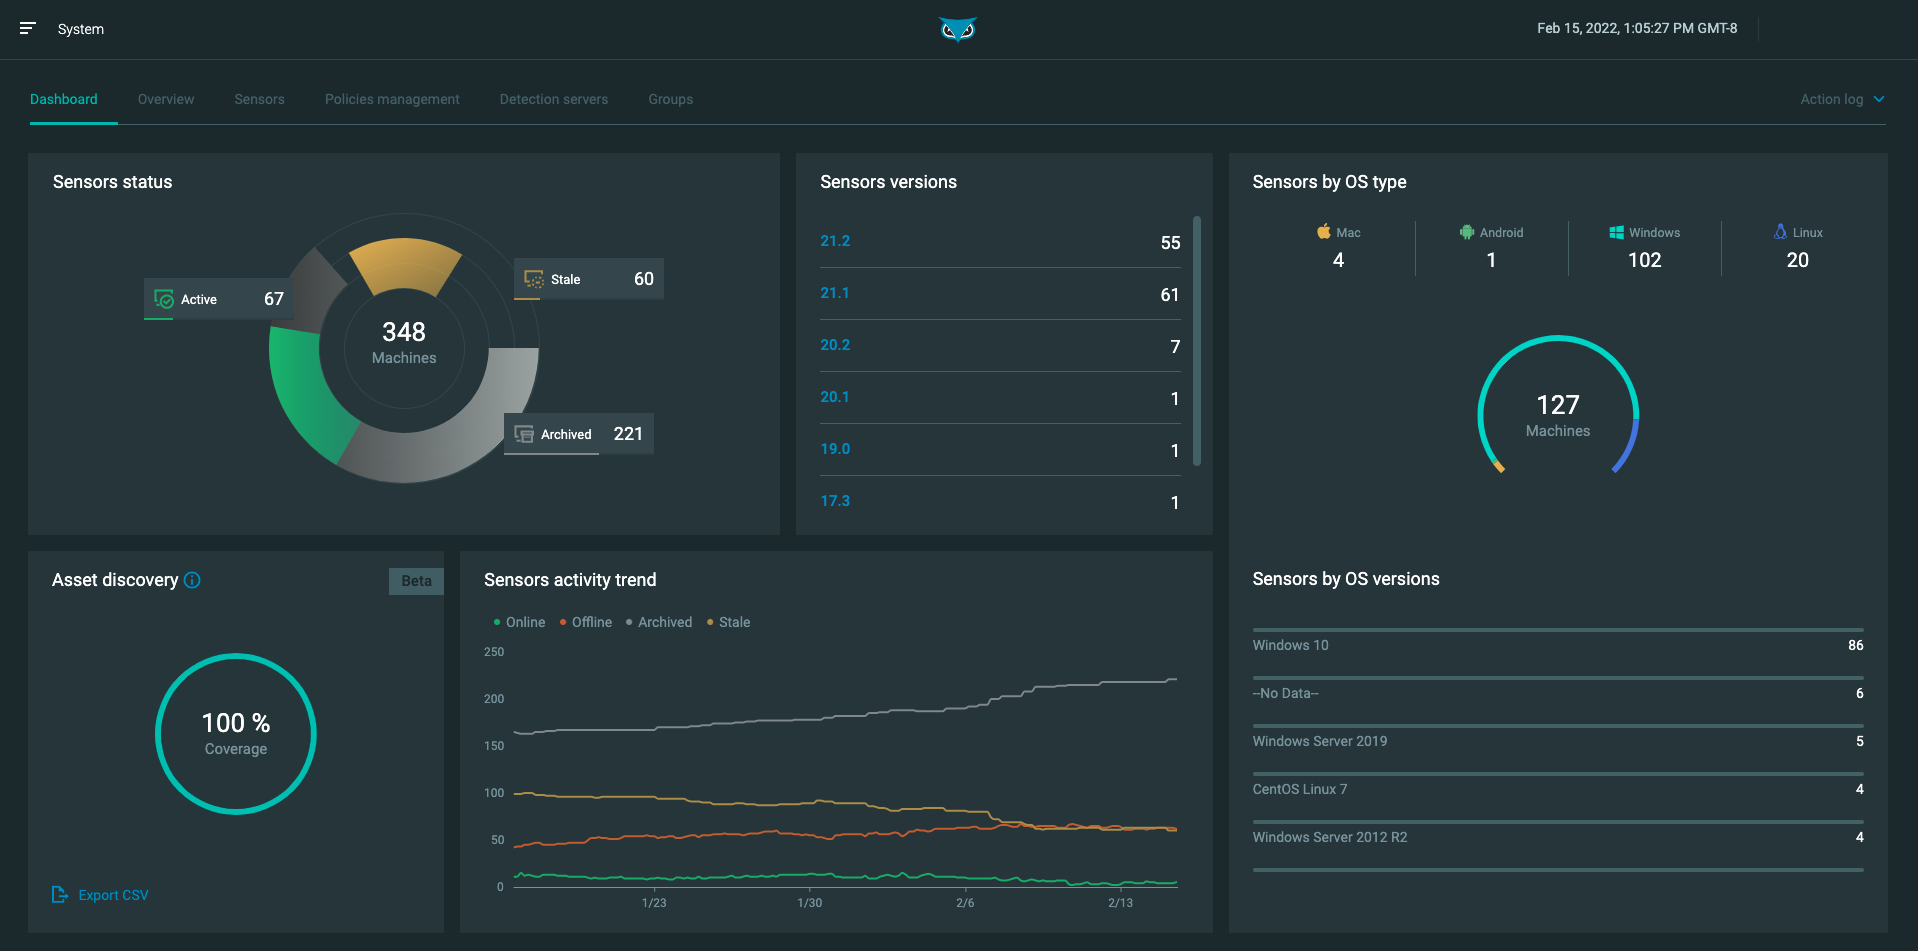
The System screen has the following tabs:
Dashboard - View a summary of your sensors, including sensor statuses, versions, OS types, and activity trends.
Overview - View general information about a server, download sensors installers, and fetch logs.
Sensors - Monitor and manage your sensors. For more information, see Monitor and Manage Sensors.
Policy management - Create and edit sensor policies. For more information, see Sensor Policies.
Detection servers - Monitor and manage your Detection servers. For more information, see Monitor Servers.
Sensor groups - Add sensor groups to enable users with the Sensor L1 admin role to manage specific groups of sensors. For more information, see Manage Sensor Groups.
Users
The Users screen lists the user accounts for the Cybereason platform.
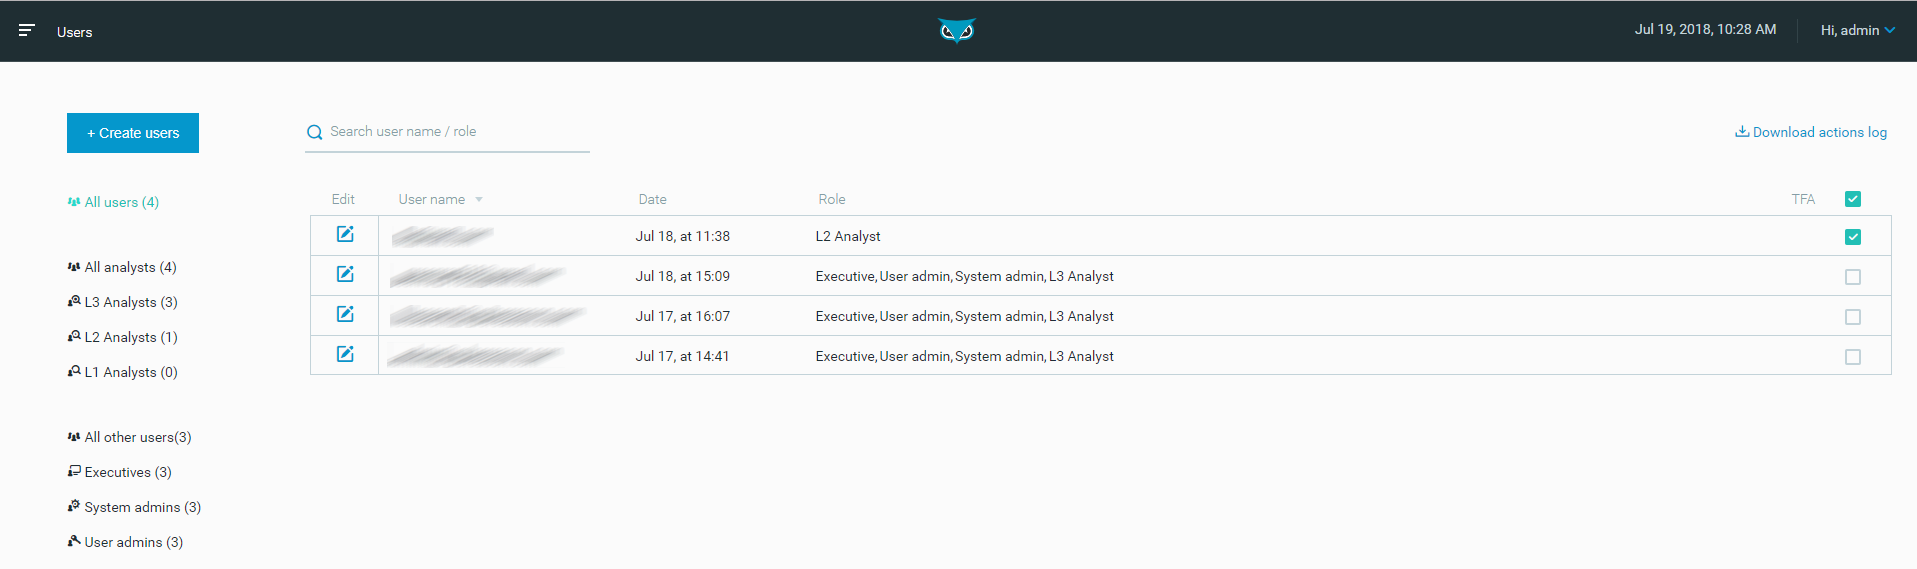
From the Users screen you can:
Create new users
Manage existing users
Set and edit security roles
Note
Individual users can manage their password and email settings. You must be a user admin to create and manage other user accounts.
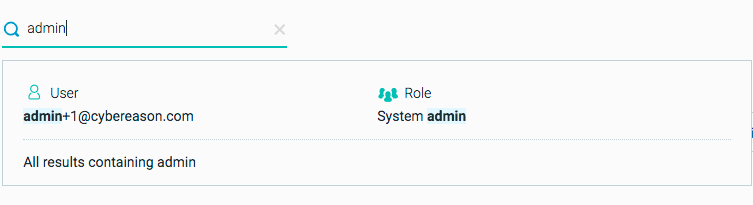
Users can see a subset of all user accounts by filtering users by role, or by searching by user or role name.
For more details on user management tasks, see Manage Users.
Settings
Use the Settings screen to configure Cybereason platform settings.
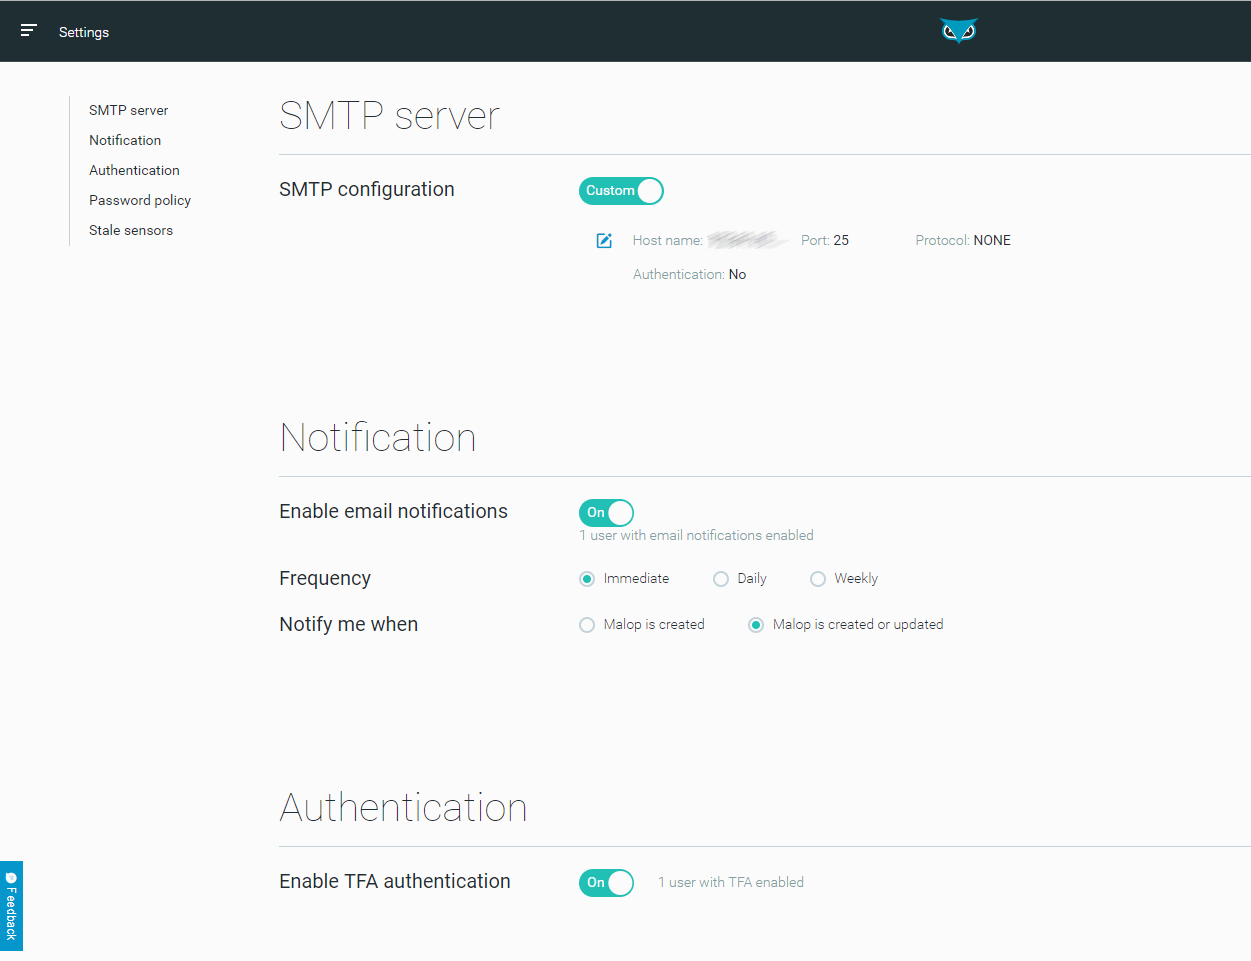
From the Settings screen you can:
Cybereason Connect
If you use Cybereason XDR, the Cybereason Connect screen enables to add integrations and manage connection details for these integrations.
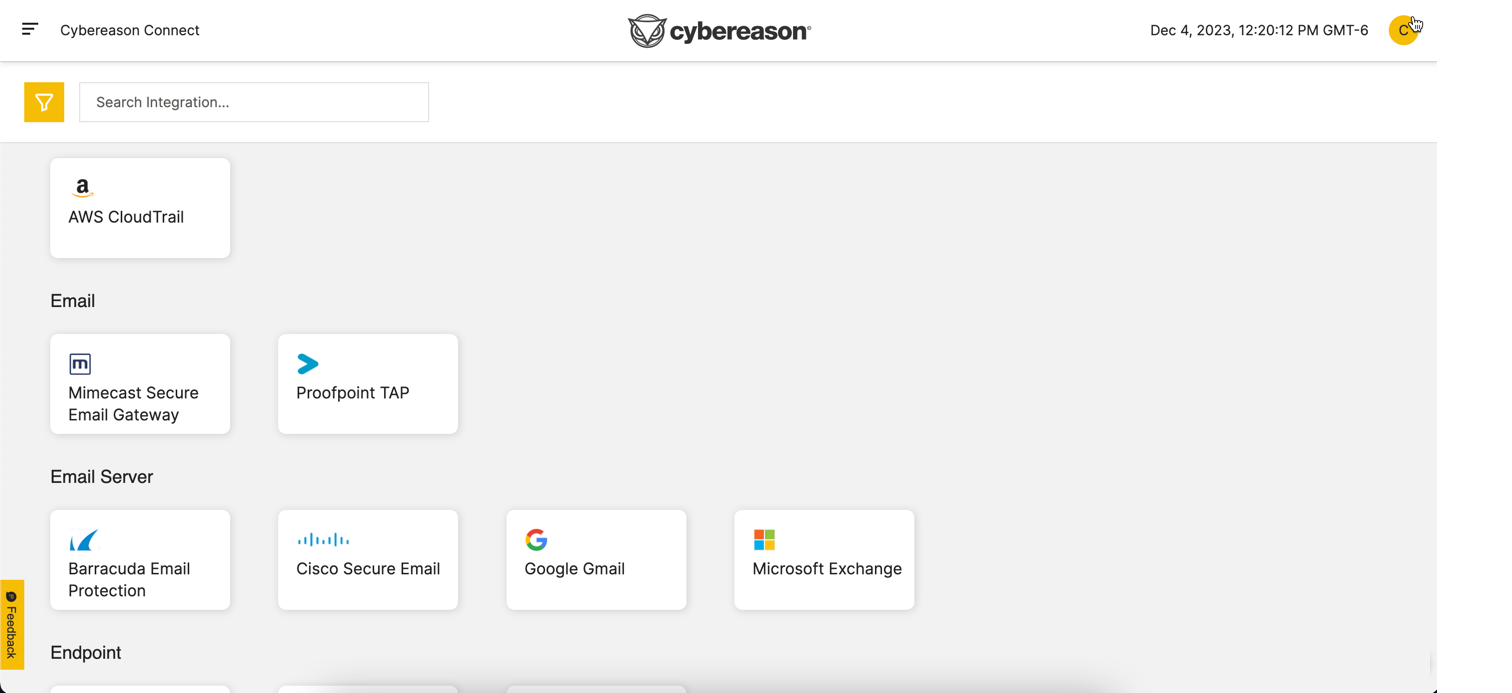
For details, see Use Cybereason Connect.