View MalOps with the Data Platform Architecture
In the Cybereason platform, you use the Malops management screen to gain an overall view of MalOps in your environment, and to manage the MalOp remediation workflow.
In this topic:
Malops management screen

Note
If you are using an environment without the newer Data Platform architecture, your Malops management screen may look different than what is described here. Visit the View Malops topic instead.
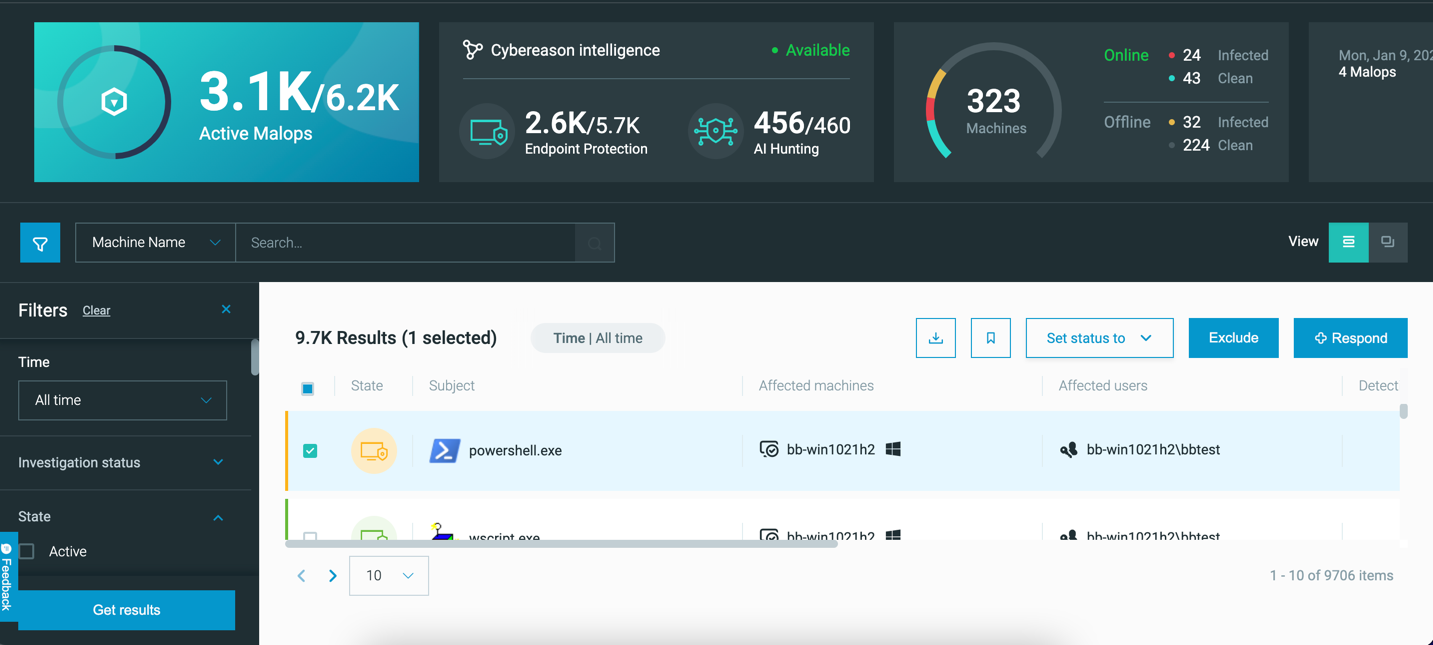
The above screenshot calls out the six main parts of the Malops management screen:
View overall statistics from the Malops management dashboard
Search for MalOps in your environment
Filter MalOps by specific characteristics
Change how MalOps appear on the Malops management screen
View details about each MalOp
Respond to MalOps (see Understand Threat Activity)
View the Malops management dashboard
The dashboard in the Malops management screen presents important information about the environment in a graphical, easy to read format.
Regardless of your filters, the dashboard on top of the MalOp Management table shows the data based on the Last One Year time filter.
Dashboard widgets include:
MalOps view |
Description |
|---|---|
Active MalOps |
Shows the number of active and total MalOps in your organization as a ratio. |
MalOps by detection module |
Shows the number of AI Hunt MalOps, or MalOps that the Cybereason platform Cross Machine Correlation Engine created, as well as the number of Endpoint Protection MalOps, or MalOps that the Cybereason platform NGAV features created. This box also shows the connection status of Cybereason’s threat intelligence services. |
Machines overview |
Information about the number of online, offline, infected, and clean machines. Infected machines have at least one active MalOp. Clean machines have no active MalOps. |
MalOps trend over past week |
A graph showing the trend of MalOp creation over the past week. |
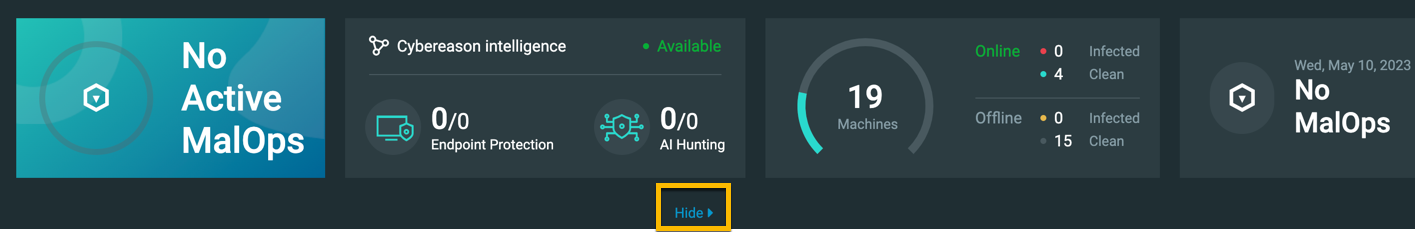
Beginning in version 23.1.125 and later, you can minimize the dashboard to view more MalOps in the grid:

Search for MalOps

Using the search feature, you can select a MalOp characteristic (Element) and enter free text to search for MalOps whose selected characteristic contains your text.
You can search by a MalOp’s associated:
Subject
MalOp name
Label
Root cause hash
MalOp GUID
Machine name
User Name
For example, a search for admin with Machines selected will return all Malops that have affected machines with admin in the name, but will not return MalOps where admin only appears elsewhere, such as within an affected user’s username.
Filter Malops
Select the filter icon to open the filter menu. You can filter by:
Filter |
Example |
|---|---|
Time range |
The time the MalOp was created. You can select All time, Today, Last week, Last month, Last three months, Last year, or a custom time range.
Note When you filter by a time range, the Malops management screen updates the MalOps in the list, but not the dashboard widgets. |
MalOp investigation status |
|
MalOp state |
The state of the MalOp that the Cybereason platform assigns for the MalOp.
|
Detection engine |
The engine that detected a MalOp.
|
Detection type |
Filter by Potentially Unwanted Programs (PUP) (versions 23.2.20 and later). |
MalOp priority |
The priority an analyst assigned for a MalOp.
|
MalOp severity |
The severity of the MalOp assigned by an analyst. You can filter by High, Medium, or Low. |
MalOp labels |
Any custom labels applied to a MalOp.
|
Machine status |
The status of the machines on which the activity represented in a MalOp occurred.
|
OS type |
The type of operating system (Windows, macOS, or Linux) for the machines associated with a MalOp.
|
Protection type |
The automatic protection action taken by the sensor for the activity represented in a MalOp.
|
User privileges |
The privilege level for the users associated with the MalOp.
|


Applied filters display above the results, which enables you to remove one of the filters while viewing the results.

In versions 23.1.125 and higher, click Clear filters to remove the current filters:

For a description of the different values used in the filters, see the section below on Select data to view.
Change how Malops are displayed

Next to the View label, choose between the Grid view and Card view. The only difference between the two views is in how the Malop information is presented in the Subject column, as described below.
View |
Description |
Suitable for |
|---|---|---|
Grid |
Displays a brief description of the Malop, including the triggering item and a matching icon (e.g., Firefox logo for Firefox processes) |
Actively working with Malops, such as assigning priority, escalating, or responding. |
Card |
Displays information about the Malop, including the triggering item, primary root cause, and detection type. This view also displays different infographics depending on the subject’s behavior (see the following table). |
Quickly assessing threats. |
If you select the Card view, you are able to see additional information. The following table describes the infographics that are visible when the Subject column card view is active.
Behavior |
Graphic |
Graphic Description |
|---|---|---|
Command and control |
|
Network icon on a server connection to the target machine. |
Reconnaissance |
|
Process icon with radar image connected to target machine. |
Injection |
|
Process icon with code pointing to an additional process connected to the target machine. |
Persistence |
|
Process icon pointing to an anchor connected to the target machine. |
Ransomware |
|
Ransomware icon connected to locked files connected to the target machine. |
Lateral movement |
|
Process icon with an arrow branching to multiple machines connected to the initial target machine. |
Credential theft |
|
Process icon pointing to a badge connected to the target machine. |
Known malware |
|
Process icon with a shield connected to target machine. |


Select a sensor group
If you enable sensor grouping, analysts with the Local Analyst L1 and L2 role can view MalOps associated with the sensors in the sensor groups the user has permissions for.
To select which sensor group MalOps to view, check the relevant boxes in the sensor group drop-down menu on the right, above the list of MalOps.

For more information on local analysts and sensor grouping, see Manage Sensor Groups.
Select data to view
Use the column icon on the upper right of the results to customize which columns to view.
Column options include:
Column name |
Description |
Values |
|---|---|---|
State (icon) |
The type and state of the MalOp |
MalOp type:
MalOp states:
For more information, see Malop Types and Components. |
Subject |
Brief description of the item involved in the MalOp |
Grid view:
Card view:
|
Group (for environments with sensor grouping enabled) |
The names of the groups to which the machines associated with the MalOp belong. |
Group names |
Resolved by |
Populated if the MalOp was resolved. |
One of the following:
|
Affected machines |
Machines associated with the MalOp |
Machine name, or machine count if more than one machine is involved |
OS type (icon) |
Machine types associated with the MalOp |
|
Affected users |
Users associated with the MalOp |
User name, or user count if more than one user is involved |
User privileges (icon) |
Type of users associated with the MalOp |
|
Detection description |
The type of behavior that triggered the MalOp |
For Endpoint Protection MalOps:
For AI Hunting MalOps, see the list of MalOp types in the MalOp Types topic. |
Detection modules |
Which Cybereason component detected the malicious behavior |
|
Start time |
The time the MalOp was triggered |
Month day, year at hh:mm:ss AM/PM timezone (ex. September 25, 2019 at 01:22:45 PM GMT-5) |
Update time |
The last time the MalOp was updated |
Month day, year at hh:mm:ss AM/PM timezone |
Escalation |
Whether or not the MalOp is currently escalated |
Escalate button or ‘x’ button to de-escalate |
Severity |
The severity of the threat as determined by Cybereason. |
|
Priority |
The priority setting for the MalOp |
|
Labels |
Custom labels |
Label name |
Protection type |
The type of automatic prevention action taken by the sensor on the machines associated with the MalOp. |
Any of the following values:
|
As needed, in versions 23.1.125 and later, you can sort the columns accordingly to help you view the MalOps in a more meaningful way.