Examine MalOp Details
For each MalOp, the Cybereason platform presents a high-level summary of all the important information for the MalOp in the Malop details screen.
In this topic:
Malop Details
You access a MalOp’s Malop details screen by clicking the on the Malop from the Malops management page. The Malop details screen then opens in a separate tab.
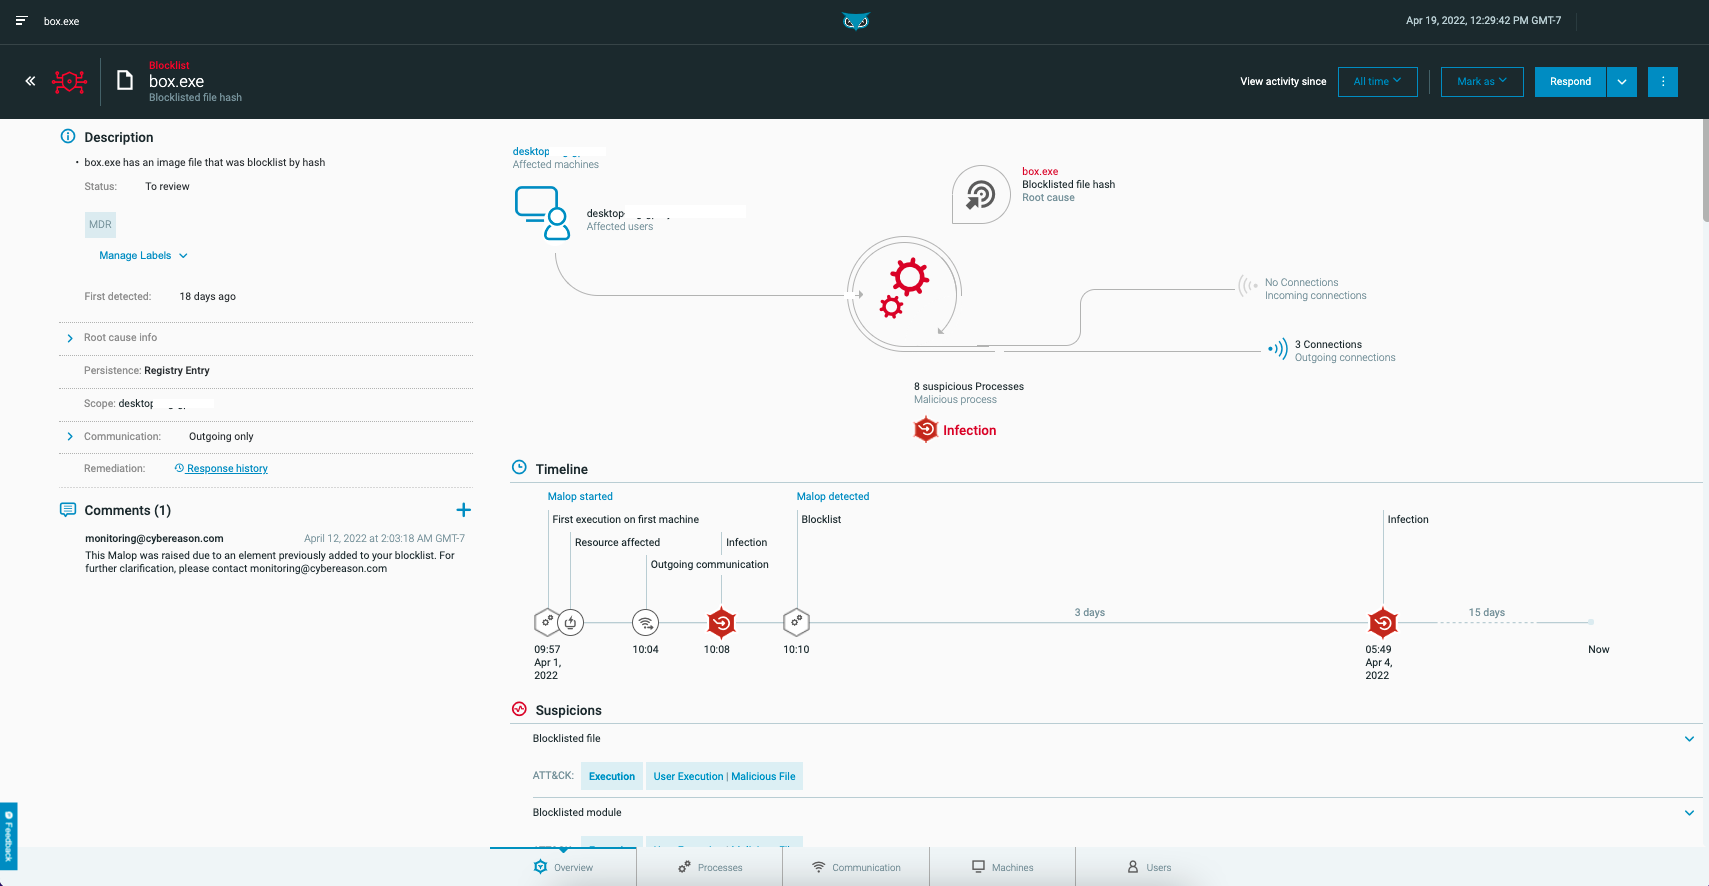
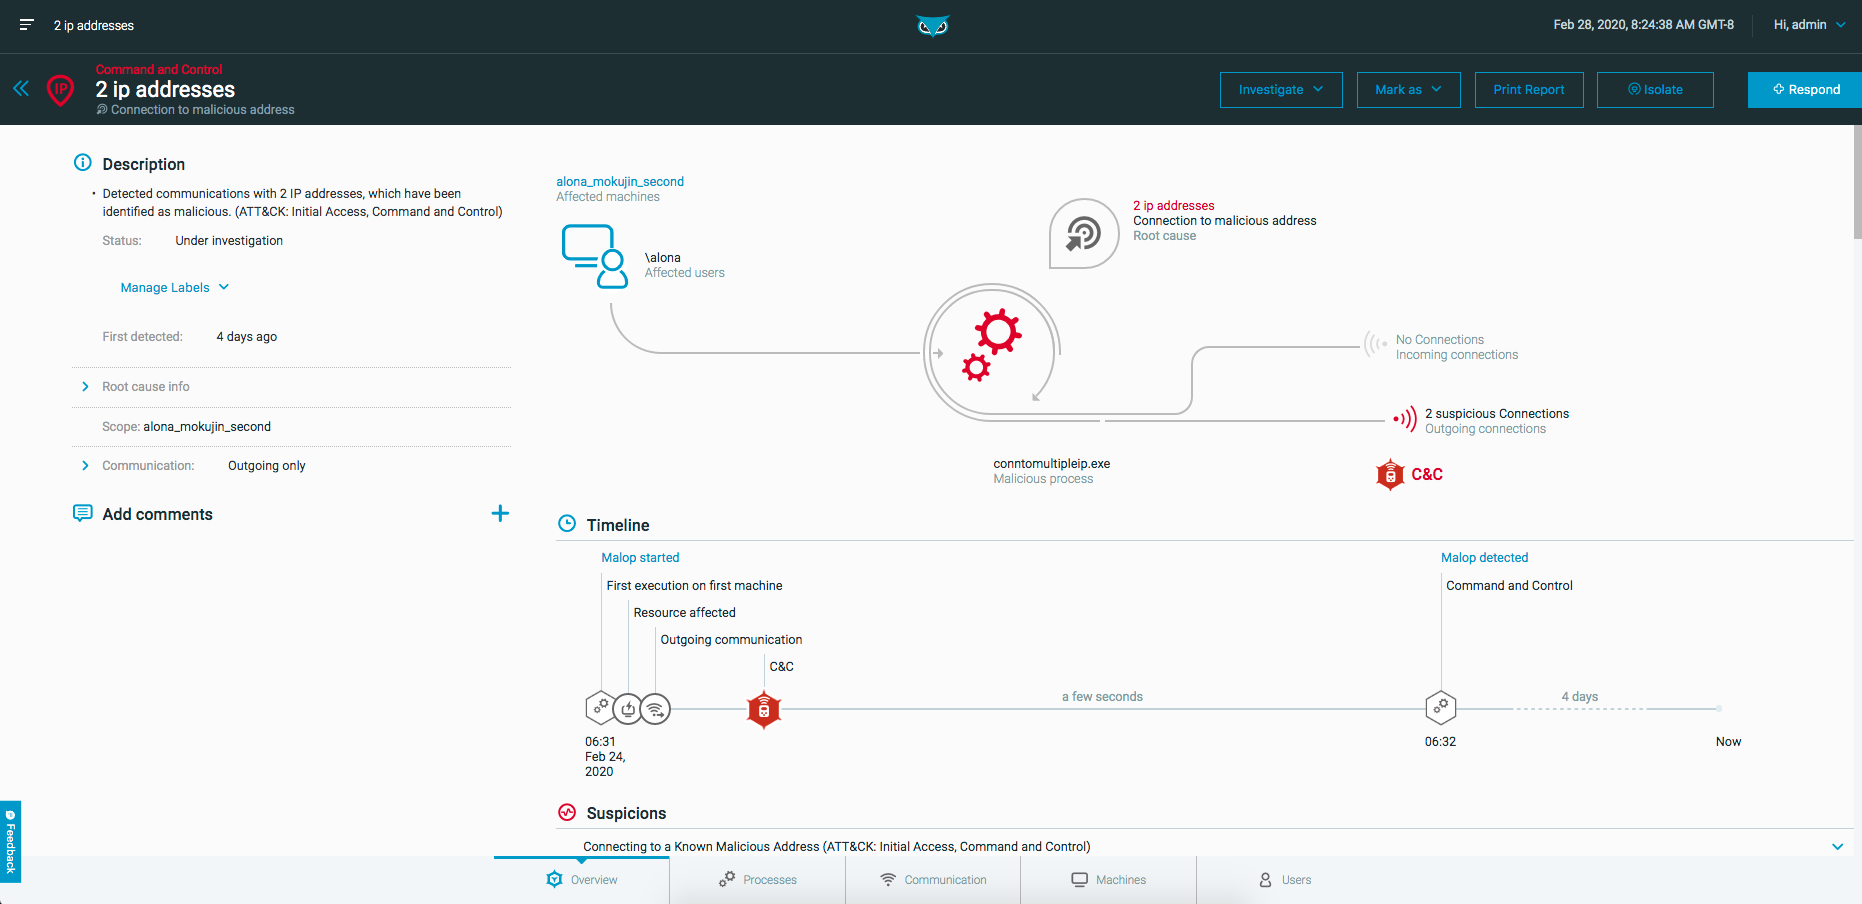
The upper left corner of the Malop details screen displays the MalOp type and root cause.
For AI Hunting MalOps, if the MalOp has been reopened, you can narrow down the information displayed using the View activity since option in the upper right corner of the screen. The View activity since option allows you to customize what activity is shown on the Malop details screen. Options are:
All time: Displays all activity related to the MalOp.
Remediated: Displays only the activity that occurred since the MalOp was reopened.
Custom Date/Time: Displays only activity that occurred since the specified data/time.
Depending on the MalOp, the screen contains the following sections:
Overview
Process
Files
Machines
Users
Communication
Overview section
The Overview section provides the high-level details of the MalOp, including a description, comments section, and a visual diagram. The diagram displays affected users and machines, the type of MalOp and its root cause, the process that was involved, and incoming and outgoing connections.
Below the diagram is a timeline of the MalOp’s activity, showing the stages the MalOp has reached, including suspicions, connections and machines affected.
Note
If there are multiple occurrences of the same type of suspicion, the timeline shows the suspicion once. You can see the full list of suspicions in the Suspicions area below the timeline.
Processes section
The Processes view gives you an in-depth look at the malicious process. This view shows:
The modules that the process loaded
Any network connections or DNS requests the process made
Whether and by whom the process is signed
The hash for the file
Where the process is running
The suspicions that caused Cybereason to label the process as a MalOp
The modules or child processes
From the left side of the Malop details screen > Process profile area, you can Hunt with the Attack Tree to view a specific process’s chain of execution from start to finish.

Files section
The Files section appears for Endpoint Protection MalOps, and lists information about files that are associated with the detected malware.

Machines section
The Machines section provides you with:
Information about the machine on which the MalOp was discovered.
Details to help you compare what is happening on all the machines with the given MalOp
View how many users are defined on the machine
View machine details, such as the operating system, number of processes, and any network connections the machine is making.

Users section
The Users section provides information about:
Users for the affected machine
Information about the domain to which the user is connected and the organization to which the user belongs.
Details on the user’s privileges
Details about the last time the user changed his or her password.
Lists the processes that are running on the machine, along with the account each process is running under. You can click a process to see additional processes that are running under the same user account.

Communications section
The Communications section provides information about any incoming and outgoing communications that are associated with the malicious behavior.

Next Steps
See the topics in the Analyze MalOps and Determine Threat Level section for guidelines of investigating the different properties displayed in the Malop details screen.