Historical Data Lake
Note
The Historical Data Lake is only applicable for existing environments that have already added the Historical Data Lake module. If you are interested in using historical data retained for longer periods of time, contact your Customer Success Manager about the Historical Hunting Data packages.
The Cybereason Historical Data Lake provides extended data retention for non-malicious telemetry data collected from endpoint sensors and sent to the Detection servers. The Historical Data Lake gives analysts or those in audit or compliance roles the unique ability to hunt for and investigate data across extended periods. Retention period options range from 30 days to over a year.
In this topic:
Historical Data Lake benefits
The Historical Data Lake is useful for:
Auditing and compliance - Run periodically to comply with regular audits or verify compliance with specific policies.
Broad historical hunting - Determine whether a specific behavior or item has been persistent in the environment. Often, attackers lay dormant or perform low-profile actions to avoid detection. Broadening your investigation can help identify such instances.
Identifying insider threats - Investigate specific machines or users over longer periods of time.
Applying the latest threat insights to historical data - Analyze past attacks with knowledge acquired since the time of attack. For example, look for the IP address of a Command and Control server that was not known to be malicious at the time of the incident.
How the Historical Data Lake works
The Historical Data Lake feature starts with data compression. The Cybereason platform compresses full telemetry data from the endpoint and stores it in a recordings archive. Then, the platform identifies key static elements, such as domain name or IP address, within the archived data.
As an analyst, you query the indexed data to identify which records to unarchive to complete your specific task. This unarchiving is called a “replay”. From the replayed data, you can perform the same in-depth queries and investigations as you would on live data.
This process is described in more detail in the following graphic:
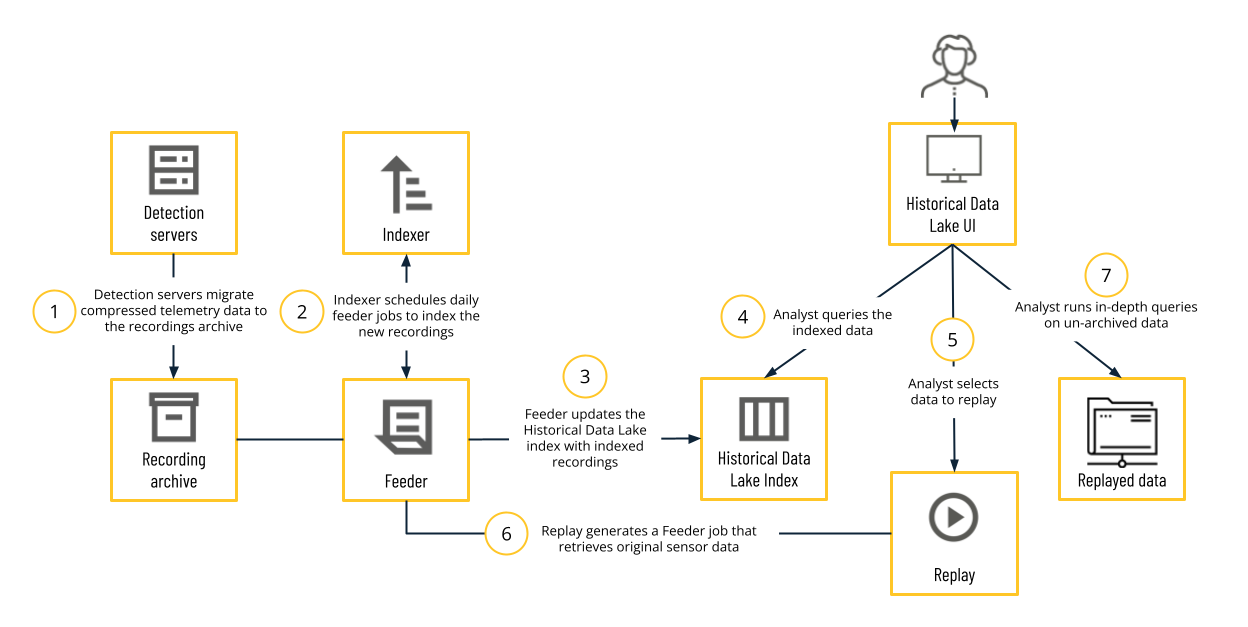
Cybereason Detection servers compress data recordings with full telemetry data from endpoint sensors and store the data in a recordings archive.
The Cybereason platform uses a daily indexer to identify key static elements, such as domain name or IP address, within the archived data.
After indexing the recordings, the Cybereason platform updates the Historical Data Lake index using a Feeder module.
As analyst, you query the data retention index to receive a report of instances that match your query. From these results, you can determine which instances warrant further investigation and fetch the full telemetry data for those instances. This action is called a replay.
Initiating a replay generates a Feeder job. The Feeder retrieves the raw telemetry data that the Cybereason platform originally gathered from the endpoint sensor, and then organizes, aggregates, and correlates the data to make it accessible for investigation.
The Feeder pushes the correlated data to a dataset on which you can run complex queries.
Using this data, analysts can perform the same in-depth queries and investigations as they would on live data.
Historical Data Lake UI and Users
The Historical Data Lake UI provides insight into the historical telemetry data retained by your data retention package.
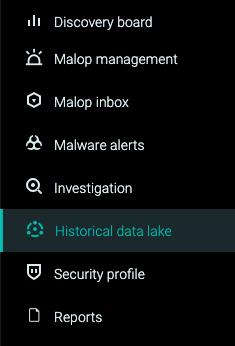
System administrators and users with the HDL analyst role can access the Historical Data Lake UI in one of two ways:
Through the Cybereason platform UI main menu. This requires that you log in to the Cybereason platform with SSO. For more information about using SSO, see Enable and Use SSO with Cybereason.
Through a URL that is separate from the core Cybereason UI. To log in, use the email address and password associated with your Historical Data Lake account. This may be different from the email address and password that are associated with your Cybereason platform account.
Note
If SSO is enabled in your environment, you cannot log in to the Historical Data Lake through a separate URL (outside of the Cybereason UI). If you attempt to log in to the Historical Data Lake through a separate URL, you will be redirected to the Cybereason UI login page.
User administrators can grant the HDL analyst role from the Cybereason UI Users screen.
Historical Data Lake workflow
Cybereason recommends the following workflow for HDL analysts when working with historical data:
Run queries on indexed data: Build an initial query on all indexed data to determine what data to replay.
Review reports: Preview the results of the initial query and run additional queries as necessary to further narrow down results.
Replay data: Replay selected data across machines (up to 20) and dates (up to 14 days) to get full details.
Run queries on replayed data: Query the replayed data to further investigate what occurred.
View details on replayed data: View more details about your replayed results.
Run queries on indexed data
To build initial queries:
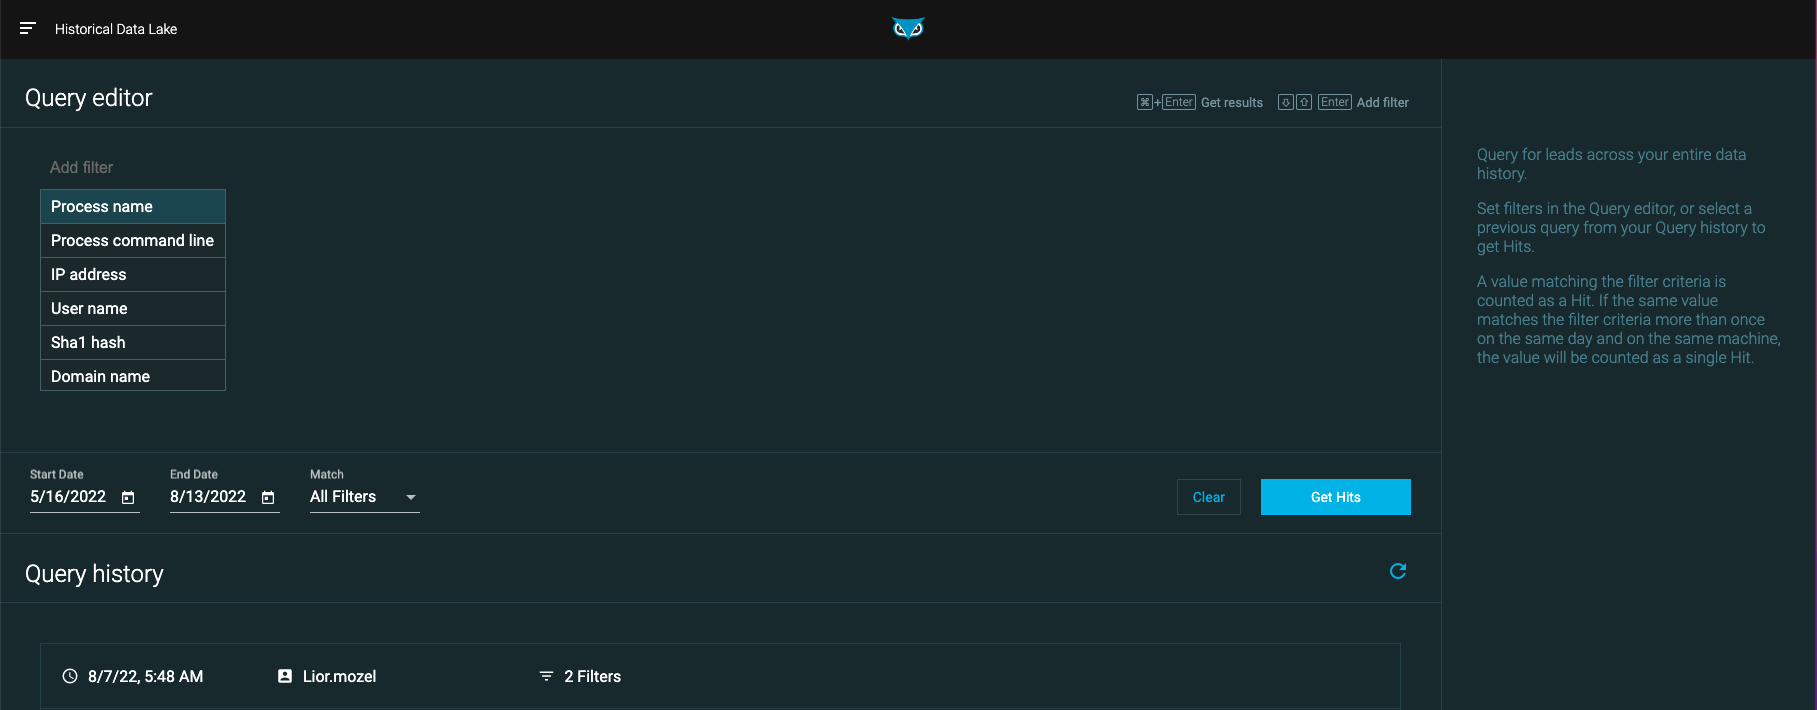
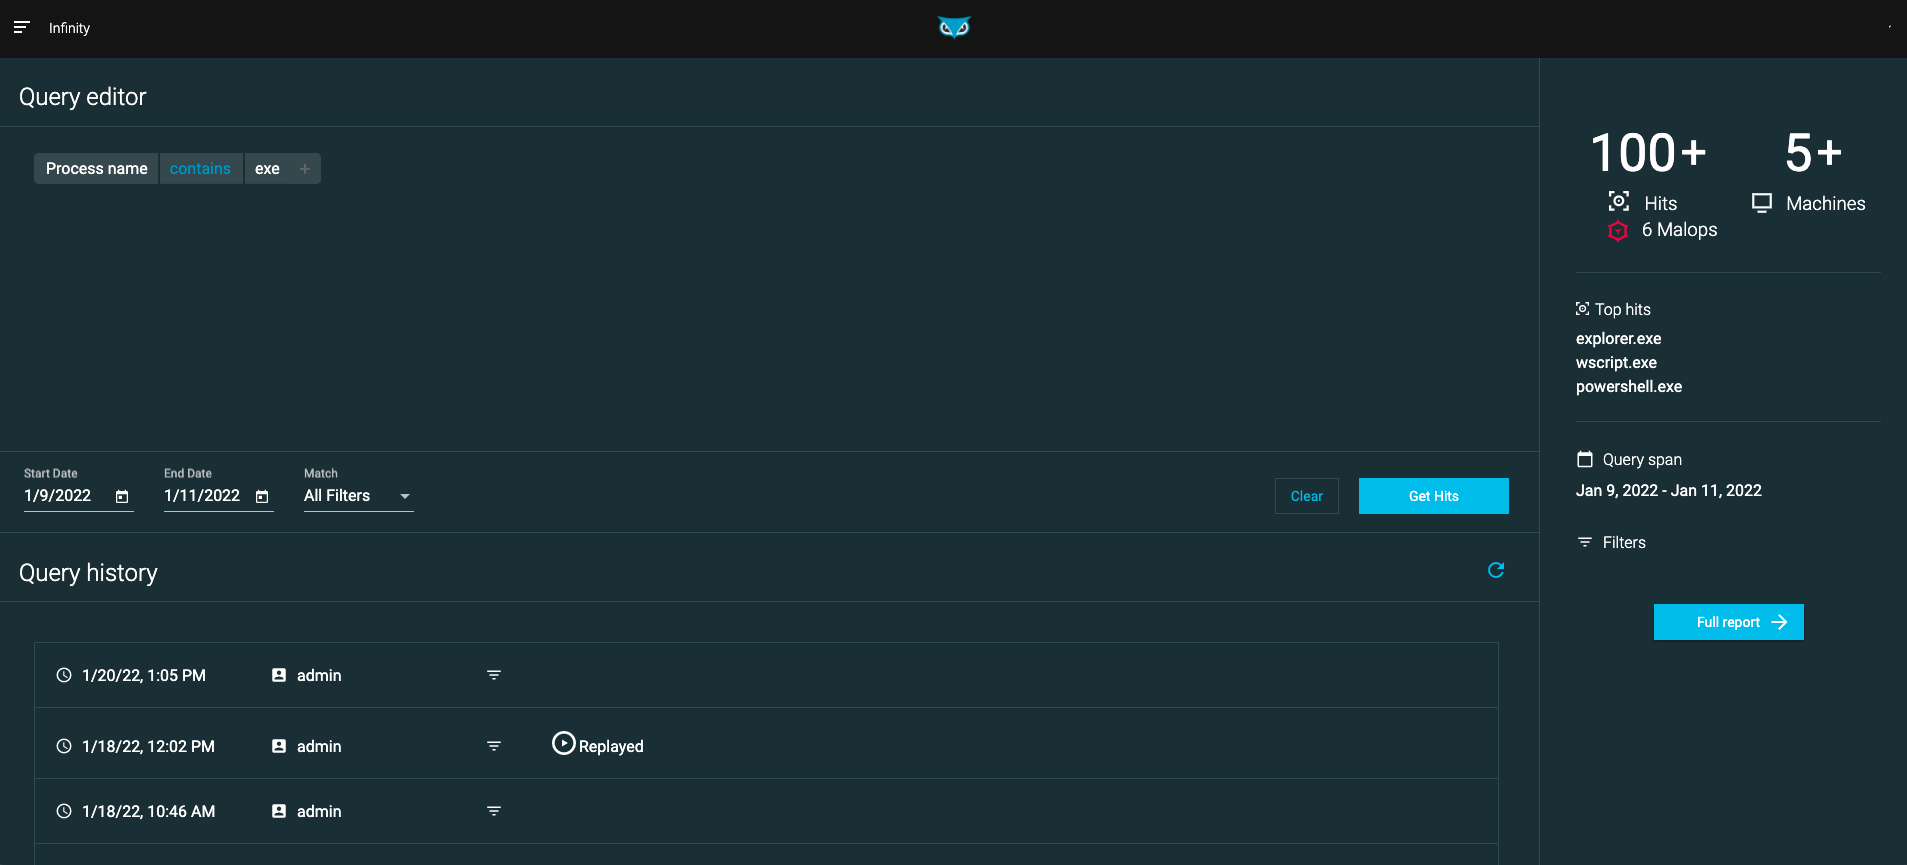
Navigate to the home page Query editor section.
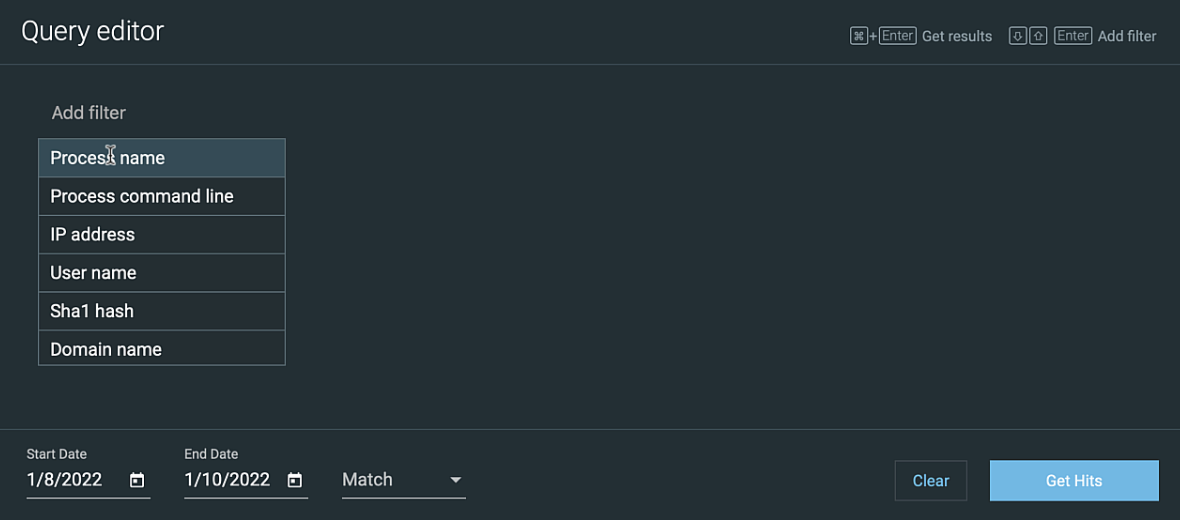
Select one of the following static Features to begin your query:
Process name
Process command line
IP address
User name
Sha1 hash
Domain name
Continue building your query by adding additional filters and values.
Note
You can only use the Features listed above as query filters.
If your query contains more than one filter, select one of the following from the Match drop-down menu:
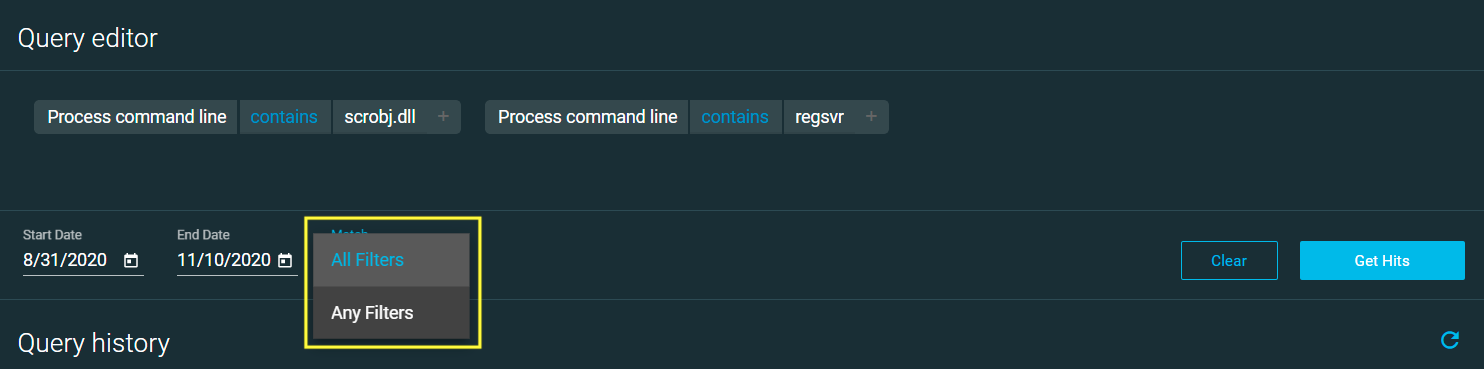
All Filters (default): Return hits that satisfy all components of your query
Any Filters: Return hits that satisfy at least one component of your query
Use the Set date field to choose a time frame over which to apply your query. Your available time frame depends on your retention period.
Select Get Hits to retrieve results, or Clear to clear the query.
After you run a query, a preview of the query results appears on the right of the screen, including the number of related Malops from your live environment. If a value was found more than once on the same machine on the same day, Cybereason lists those occurrences as one aggregated result.
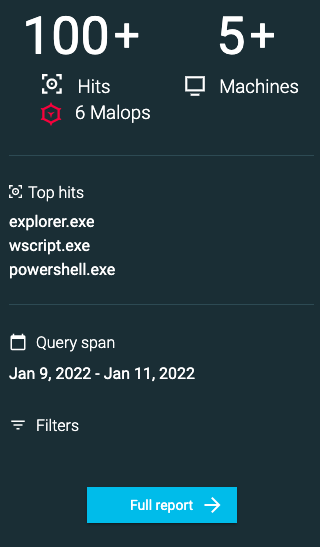
Select Full Report to go to the Report screen and investigate the results of your initial query.
The Historical Data Lake packages allow for 1000 initial queries per year, but the product is designed so that you are unlikely to reach this cap. You can run more complex queries, for example to investigate relationships between data, after you have replayed the data. Queries that you run on replay data do not count toward the 1000 query limit.
Review reports
From the Report screen, you can view initial query results, identify rare occurrences, and select specific date to replay. You specify data to replay based on machine and date.
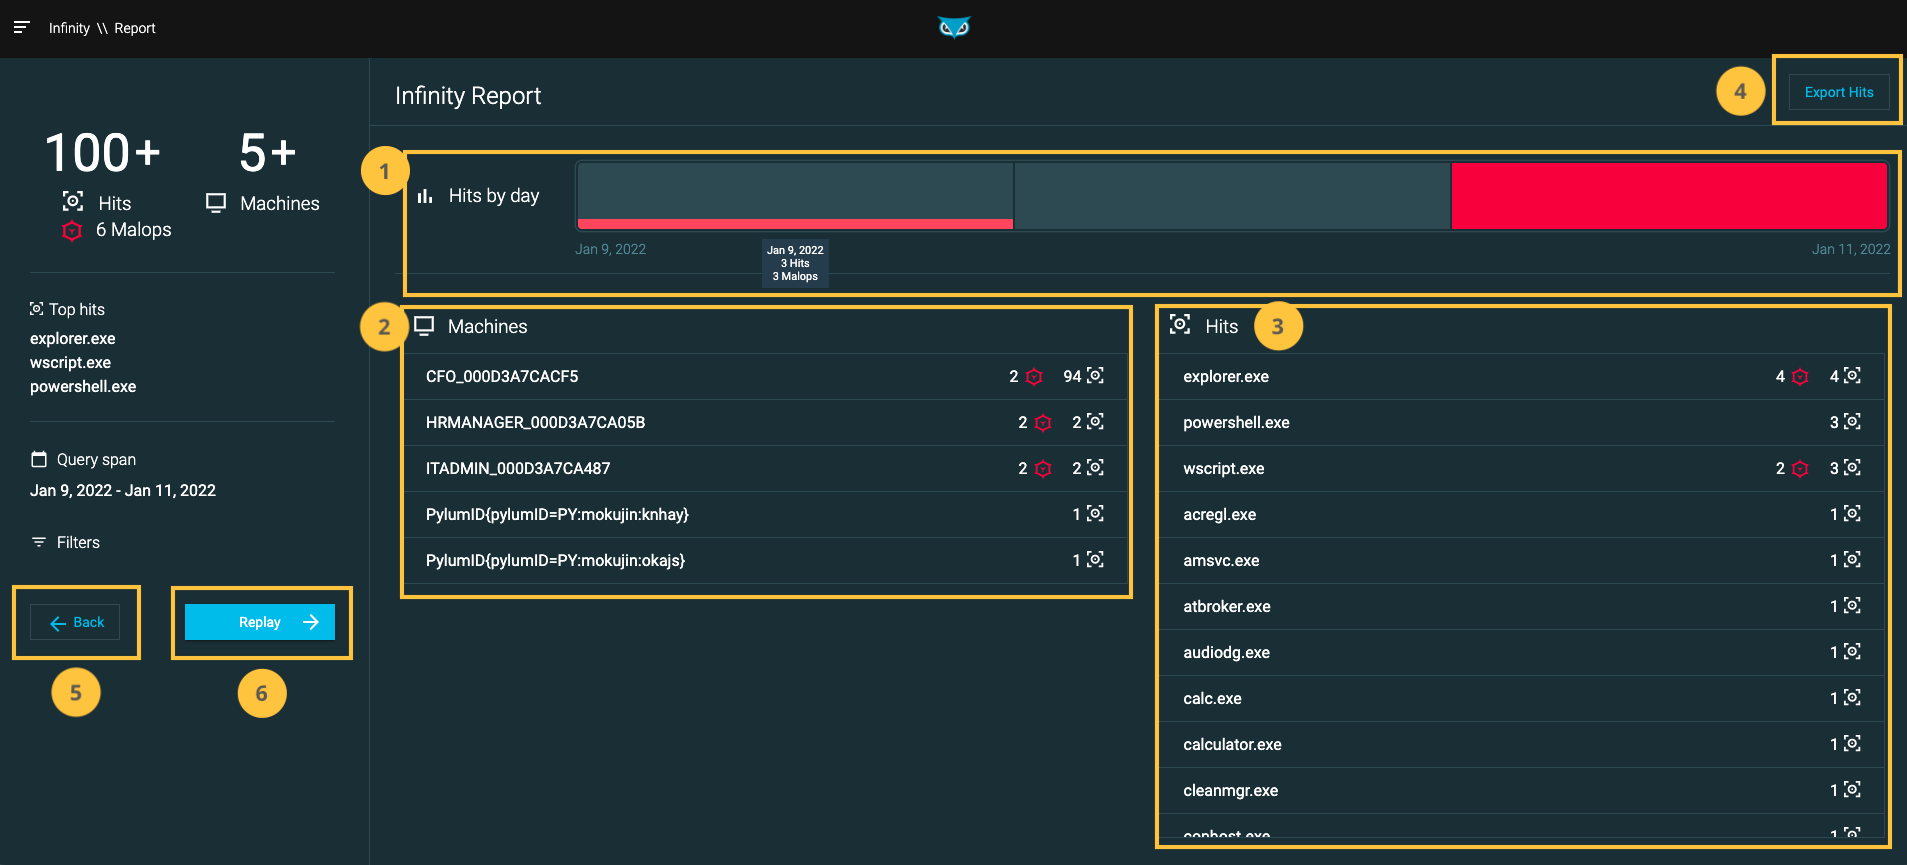
From the Report screen, you can perform the following tasks:
Filter hits by day. When you select one or more days in the Hits by day section, the Machines and Hits tables update accordingly.
Filter hits by machine. When you select one or more machines in the Machines table, the Hits table updates to include hits that were found on the selected machines.
Filter by specific occurrence (‘Hit’), as defined by the associated process. When you select one or more processes from the Hits table, the Machines table updates to include machines associated with the occurrences selected.
Export results to a CSV file (up to 10,000 results).
Go back to the query screen to refine your query. Because the Historical Data Lake packages allow for 300 replays per year, ensure your selections are as accurate as possible before you run the replay.
Create the replay. Selecting the Replay button takes you to the Create replay screen, where you can verify what machines and dates to include in the replayed data.

The Malop icon next to a machine name or process indicates how many Malops from your live environment are associated with that item. The Hits icon indicates how many items associated with the machine or process match your query.
Replay data
When you have optimized your query to produce the appropriate report, uses the Report screen to select some or all of the results that you want to replay, and then click Replay on the left side of the screen. The Create Replay pane appears.
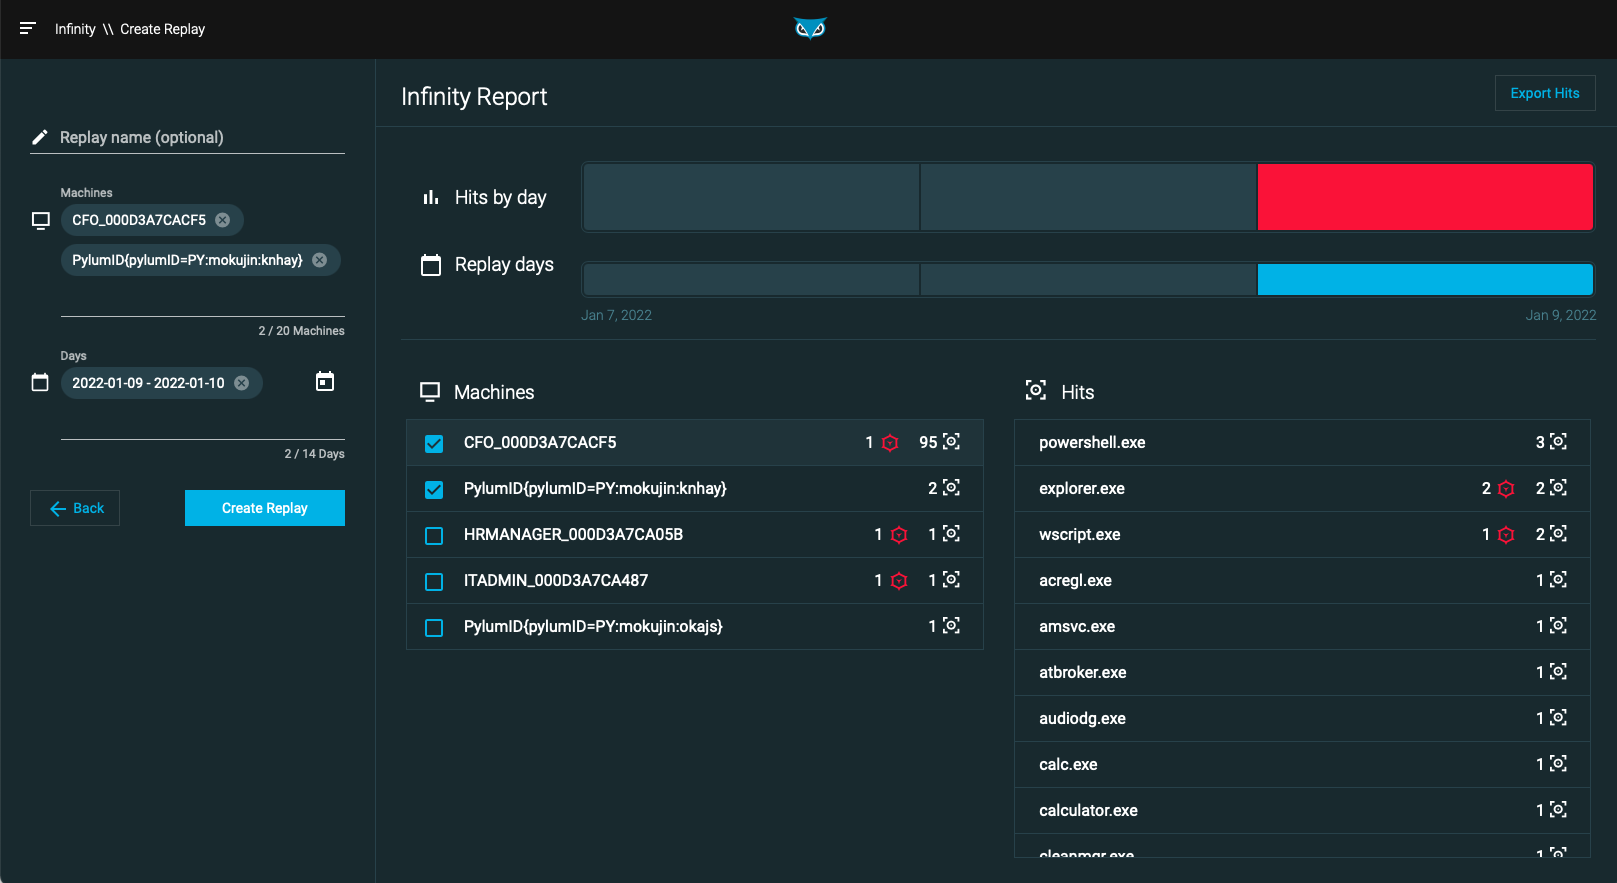
Specify a name for the replay and verify the machines and dates you selected are accurate. You can replay data from up to 20 machines across 14 days. Depending on how much data you are replaying, this process can take a few minutes.
Note
Days selected for replay do not need to be consecutive.
Run queries on replayed data
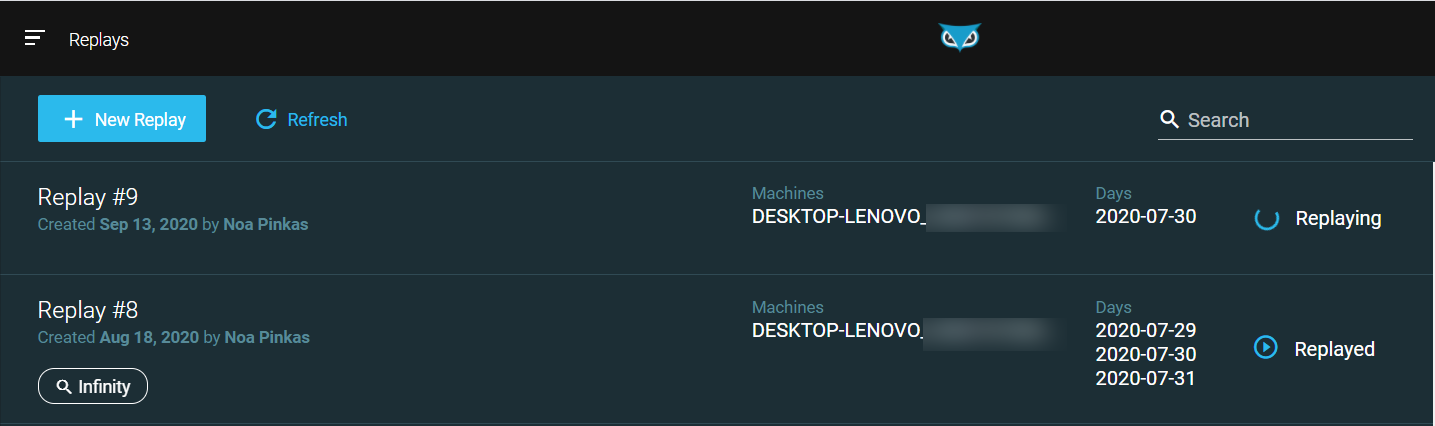
After you replay the selected data, you can run complex queries on this data from the Replays screen.
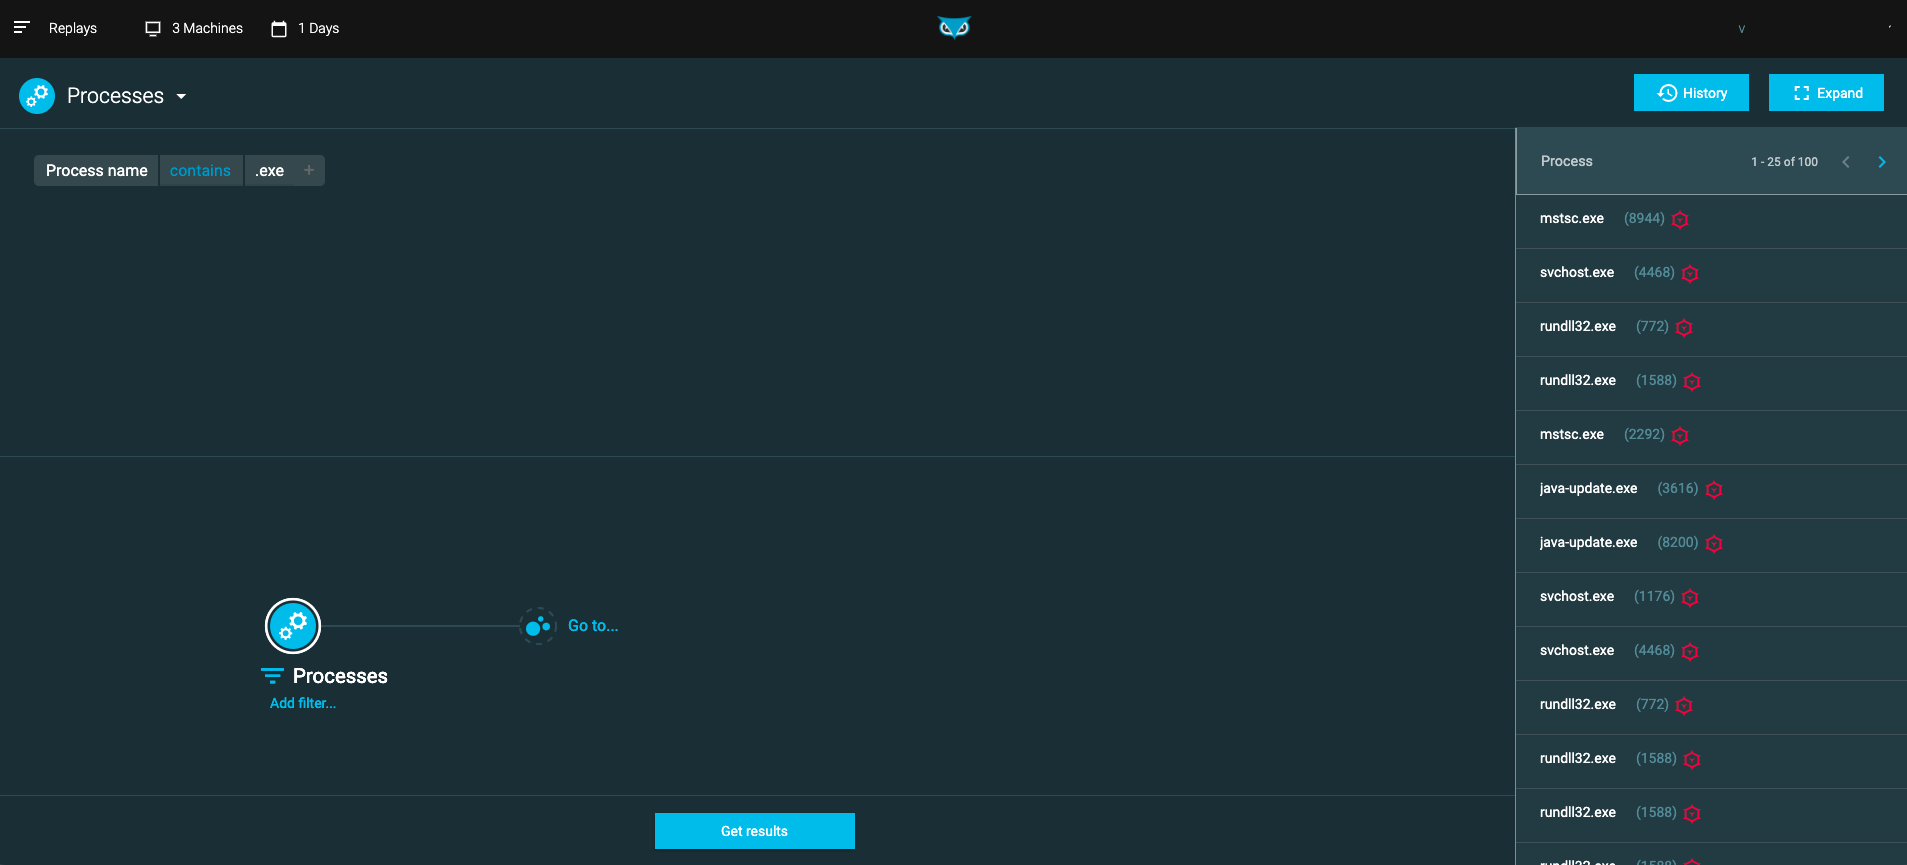
The following Elements are available for queries on replayed data:
Connection
Process (including parent processes)
Loaded modules
Machine
Image file
User
To learn more about constructing queries in Cybereason, see Build a Query.
View details on replayed data
After data is replayed, select Expand in the top right corner of the Query Editor screen to view more details.
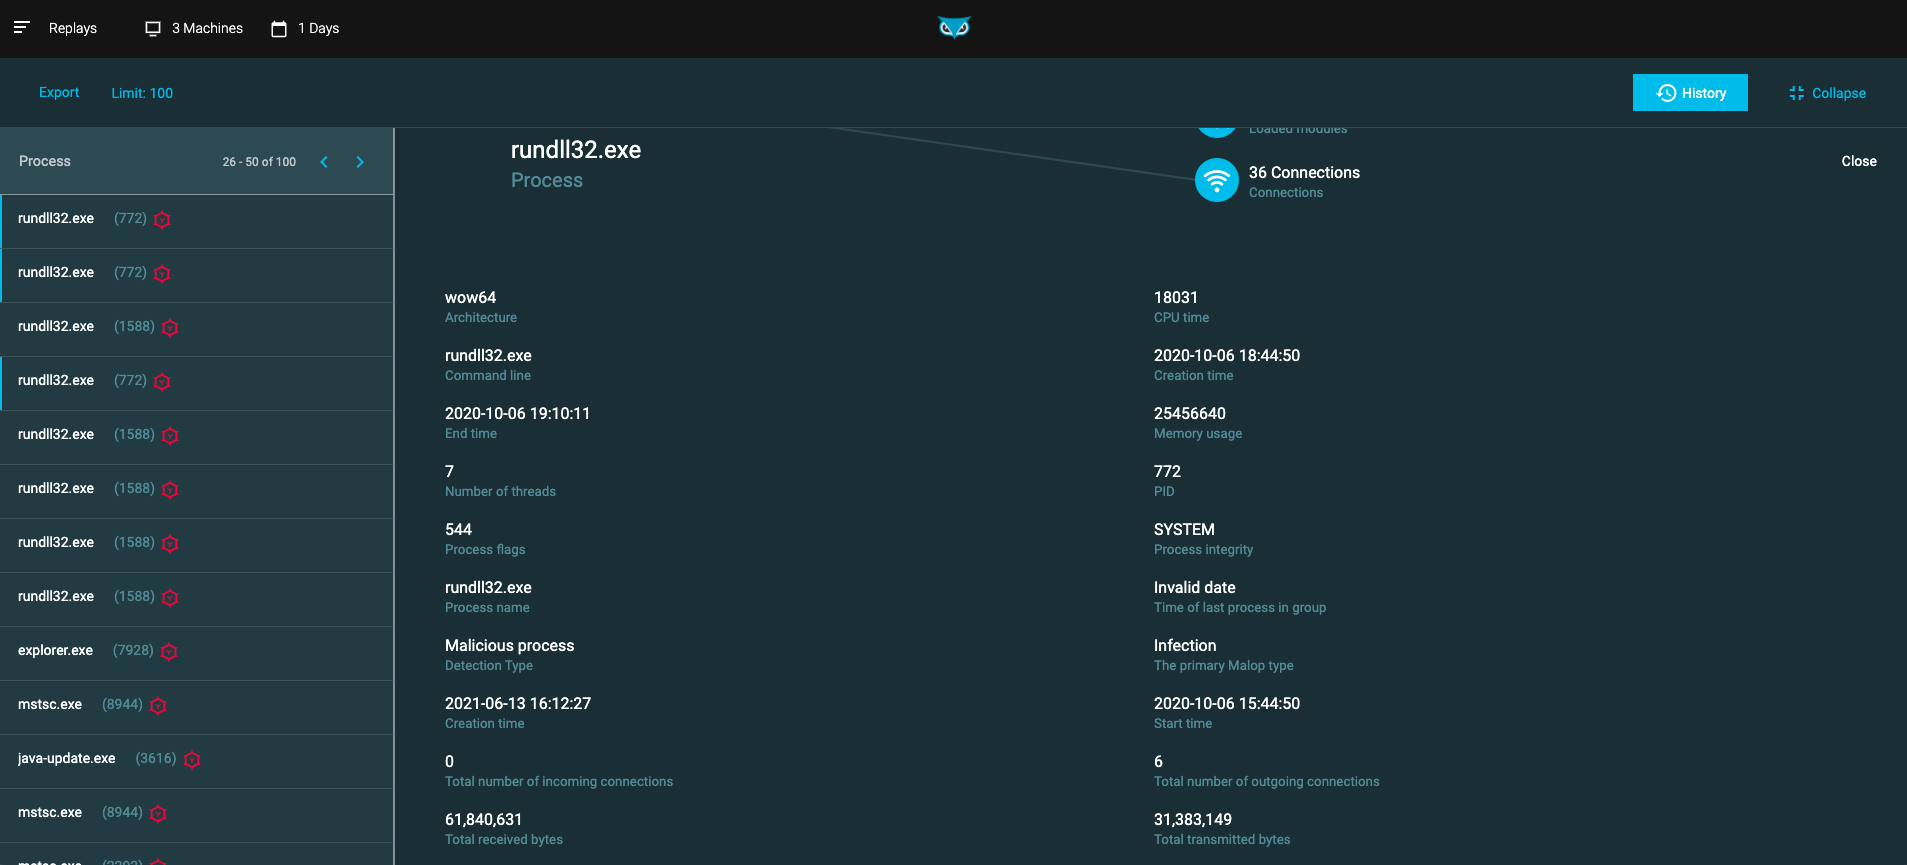
From the Expand screen, you can:
View detailed replay data in a grid
View detailed replay data in a timeline
Export replayed data details in JSON or CSV format
View replay history
To view past replays, select History in the top right corner of the Query Editor screen. You can also create new replays from this screen.