Analyze Query Results
When you run a query in the Investigation screen, the columns in the results grid display various properties (Features and values) of each result. The  indicates the number of suspicions associated with this Element. The
  indicates the number of MalOps associated with this Element.
The Cybereason platform can potentially return a large number of results. Sorting through these results and finding the details that show malicious activity is an important part of hunting and investigating.
In this topic:
Sort and filter results
Once you have built and executed a query, you can sort the results or add additional filters to better analyze your data.
Sorting and filtering is useful when assessing distribution of various Feature values in a group of Elements, getting aggregated information for machines and user activity, viewing process execution order, and for many other activities.
Select the correct Element in the query builder
The platform displays the results by Element type. The results always show the type of the last (right-most) Element in the query chain unless a different Element is selected. Make sure you have a appropriate Element selected.
Filter by timeframe
The Timeline filter (created on/existed on) allows you to restrict results to items that were created or present within a specific time frame. The Timeline filter applies to all Elements in the query that have time-based components. This includes the Connection, LogonSession, MalopDetectionEvents, MalopProcess, and Process Elements. For example, if your query contains the Connection Element as well as the Process Element, the Timeline filter will consider the timestamp for both Elements when filtering by time.

Use the buttons above the graph to quickly jump to a preset time frame (options include the last hour, 6 hours, 12 hours, or 24 hours, the last 3 or 7 days, or all data) or use the custom option. You can choose to include only items that were created within the time interval by selecting the Created radio button, or items that existed during that interval by selecting the Existed radio button. When you adjust the time frame, the results update to reflect your selection.
The bars on the Timeline represent the number of Elements that were created in the corresponding time frame.
Use the buttons to the right of the Timeline to zoom in, zoom out, or zoom to a specific selection.
Examples
Example |
Steps |
|---|---|
Investigate processes on a machine in a given time frame |
|
Investigate connections to port 443 in the last 24 hours |
|
Look for trends in file downloads |
|
Filter by Suspicion
The Suspicions tab on the top right of the Investigation screen is active for Elements that have associated suspicions.

When you select a suspicion, the results update to reflect your selection. The grid is grouped by the Elements affected by the suspicion you selected, and shows the number of times that suspicion appears, as well as the number of suspicions.

Filter by specific value in the results
You can narrow down the results of an on-going query by selecting individual values from the results to add to the filter box. For example, you may want to filter by a specific command line value you see in the Command line column.
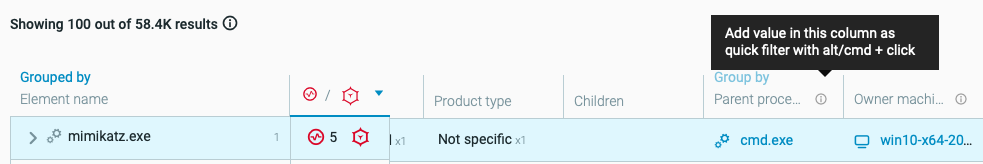
To add a specific value to the current query, use Alt/Cmd and click on the value in the query results grid. The value is added as a filter to the filter box. The following screenshot shows the result of performing Alt/Cmd + click on a specific SHA1 value in the query results. The SHA1 filter is added to the filter box for the current query.

Columns whose values you can add to the filter box with the Alt/Cmd + click command contain a tool tip indicated by the information icon.
Customize results view
Limit query results
The Cybereason platform limits the results returned by a specific query to optimize query processing. The Showing label above the results list specifies how many results were returned by the server and how many results are estimated to exist in the environment.

Limiting the number of results minimizes duplicates and allows for more relevant results. It’s important to understand the result numbers to better tailor your sorting and filtering efforts.
For best performance, Cybereason recommends keeping the default query settings. If you need to change the result limits for any reason, follow these steps:
Select the Limit results button.
Change the maximum number of results, toggle sampling, or change the time limit for query processing:
Setting
Description
Default
Role required
Up to n results
Specifies the maximum number of results to return with any single query.
100
L1, L2, L3
Sample results
Ensures a diverse result set. Each Element type uses a sampling Feature to ensure that no more than 1% of the results belong to the same sample.
Enabled
L3
Time limit
Specifies the maximum amount of time, in seconds, for a query to process. If query processing exceeds the limit, Cybereason returns partial results (along with a message informing you that results are not complete.)
120 seconds (2 minutes)
L3
Important
Changing these defaults may have severe implications on server performance and its fail-safe mechanisms.
Customize results per page
From the bottom of the Investigation screen you can specify how many results to display per page. Options are 100, 500, 1000, 2000, or 4000. You can also navigate between pages.

Manage columns
Click Edit columns to select the relevant columns to view in the results grid. The available columns depend on the selected Element.
Examples
Example |
Steps |
|---|---|
Investigate process execution times on a specific machine |
|
Discover cumulative communication traffic for a set of machines |
|
Compare command-line distribution for a set of similar processes |
|
Review the results
Once you have configured how you want the results to display, drill down into the results. Review a number of properties to help guide your analysis:
Analysis Area |
Description |
|---|---|
Frequency |
A potentially easy area to spot something out of the ordinary is through frequency (although not always). For example, if you are viewing process information, if you see a process running on many machines, there is a good chance it is a legitimate process such as operating system process. However, if there is an isolated process running on one machine, it may be worth investigating that process. Although the item may be benign, it is a starting point. |
Suspicious indicators |
For every Element, the Cybereason CMC Engine notes the evidence or suspicions associated with the Element:
Evidence and suspicions use proprietary detection rules to find questionable behaviors. If an Element has a large number of these, it gives you a point to explore further. |
Element characteristics |
For each result, the Element details show the properties of the Element and related Elements. Check the results to see if characteristics are what you expect.
Using the results in the grid and viewing the Element details, see if characteristics are what you expect. |
Attack Tree |
For Process Elements, you can view the Attack Tree which gives a chain of execution from start to finish. Analyze these processes to see if you see suspicious activity. For details on using the Attack Tree for analysis, see Hunt with the Attack Tree. |


For details on other potential avenues of investigating Elements, see Analyze MalOps and Determine Threat Level.
Export results to a CSV file
Export your investigation query results using the Export CSV button on the top right of the results grid. Columns in the exported CSV file match the columns in the UI as shown during your browser session. As a result, details in the file may be out of sync with current server data.
In addition to the UI columns, the exported CSV includes a message noting if the column contains multiple items, for example, multiple processes.
You can ask Technical Support to configure that items’ timestamps are displayed in absolute time, in the format YYYY-MM-DD hh:mm:ss:000+hh:mm.
Customers with the new Data Platform infrastructure can configure how many results are exported (up to 80,000). To understand when the new Data Platform infrastructure will be available to you, please contact your Customer Success representative.
Investigate individual Elements
After you build and run a query, you can investigate each result in the results grid. When you select a result, the Element details screen opens and displays correlated data about the result.

Details for the selected Element are categorized differently depending on the Element. For example, if you view details for a logon sessions, the Details screen shows Properties, Reputation, Local Machine, and User sections.
Some of the information is clickable, enabling you to view specific details about that Element or to download a file.
Download files
In many cases, you can download files from the Element details screen to conduct a deeper investigation of the file locally. You can download any type of executable file, which are download in PE (Portable Executable) format.
To download and open a file:
Access the Element details screen by clicking an Element in the results of an investigation.
In the Element details screen select a file available for download and click Download 1 Element, as shown below.

Access the file by clicking the download icon
 in the top right of the Cybereason UI. The file downloads as a zip file containing a .METADATA file and an additional password-protected zip file containing the file you downloaded. To open the package containing the file you downloaded, open the .METADATA file and use the password listed under “password for safe file access”. Read our Knowledgebase article for an example.
When you open the downloaded archive folder, ensure you use a program, such as Zip or WinRAR, that enable you to open and view the folder contents and add a password as part of their standard use.
Note
You can download files up to 2 GB in size. To change the default file download size, consult Technical Support. If you have multiple Detection servers, the property must be updated on each server and each server must be restarted.
Process aggregation - sensor for Linux
In many environments, machines run multiple process instances that are very similar to each other, such as system daemon processes. As Cybereason sensors send information about all a machine’s processes to the Detection and WebApp servers, this can flood the system with large amounts of irrelevant data.
To address this issue, sensors running on Linux group similar process instances into an entity called an aggregated process. The Sensor sends the aggregated process to the Detection and WebApp servers. The results display the aggregated process instead of many similar processes. This reduces noise and helps analysts focus on relevant data. It can also improve performance by reducing network bandwidth and server data storage and processing.
By default, sensors aggregate processes based on a set of parameters. Technical Support can help you modify these parameters if needed.
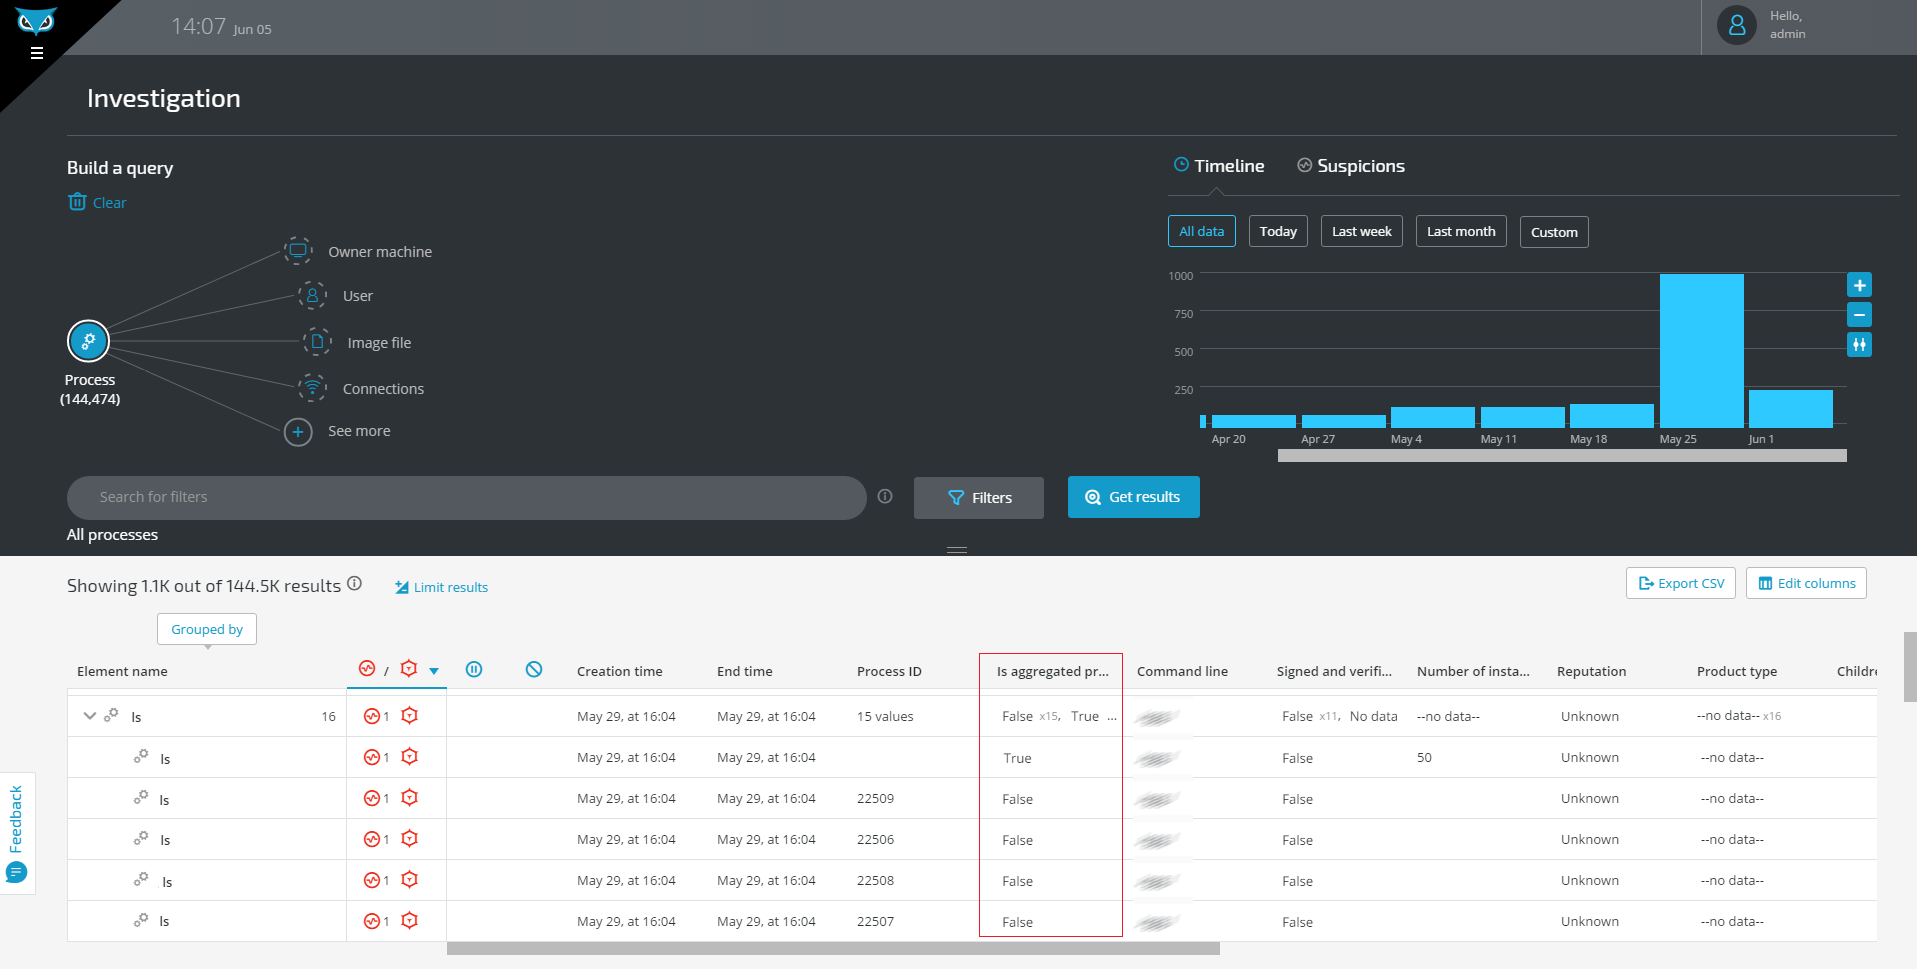
The aggregated process appears in the query results like a regular process, with the following differences:
It does not have a PID.
The new Is Aggregated field has the value True.
It includes information in the columns Number of aggregated instances, Instances in last minute, and Time of last process in group.
Aggregated process in query results:
Process Details of aggregated process:
